Racial and Ethnic Composition
People aged 55–64 have become somewhat more diverse with respect to race and ethnicity
reflecting the demographic changes in the U.S. population as a whole over the last
several decades.
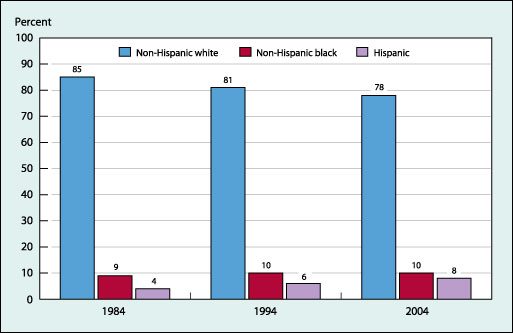
Chart 2a. Population aged 55–64, by race and Hispanic origin, 1984, 1994, and 2004
Source:
U.S. Census Bureau, Population Estimates.
- In 2004, the percentage of non-Hispanic blacks and Hispanics
aged 55–64 was greater than in 1984. In 1984, 85 percent of people aged 55–64 were
non-Hispanic whites in contrast to 78 percent in 2004. The percentage of Hispanics
aged 55–64 increased from 4 percent to 8 percent while the percentage of non-Hispanic
blacks increased from 9 to 10 percent.
Last Modified: 12/31/1600 7:00:00 PM