
Regional Modeling
What is Numerical Weather Prediction?
Numerical weather prediction is a science based on reducing the atmosphere to a series of mathematical equations to project the atmosphere forward into the future. The results are weather forecasts. We know what the current state of the atmosphere is more or less, from piecing together a series of surface and upper air observations that may come from ground-based weather stations, balloons, aircraft, and satellites. Through the equations we know that certain physical laws must be obeyed, accounting for movement of air i.e., winds, or how the air heats or cools, or how clouds form, and whether rain occurs. This is a weather prediction, a look into the future if you will, of how conditions will be in your area at some number of hours or days into the future. We do this by breaking up the globe into a series of sub areas represented by “grid points”. The model then makes a forecast for each of these points. If the points are very far away from each other the model is said to have coarse resolution and the forecasts is only representative of very large areas, and may not be exactly the weather where you may be located.
What is Regional Numerical Weather Prediction?
When we talk about regional modeling or regional numerical weather prediction we are really doing the same thing except that we are focusing on more and more detail for the region where you are located. Here, the resolution is higher (i.e., the grid points are closer together). Regional modeling is capable of predicting weather for your part of town, the lake where you sail your boat, the track of your airliner, the island you visit, or the mountain you ski on. It can simulate the hurricane that is threatening the coast, the big thunderstorm that is bearing down on your town, the flow of polluted air out of an industrial area, or conditions near a wildfire and where the smoke will travel.
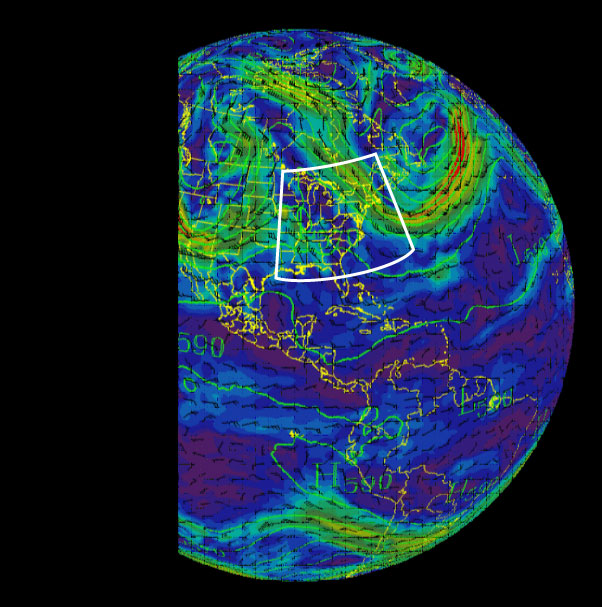
Regional modeling requires that we know what is going on at the global scale so we may “zoom” in to determine all the detail that is discussed above. In the figure below we set up a regional modeling domain (white box) for some area of interest on earth. The term used is that the regional model is “nested” within the global model.
Why is it Important?
Regional modeling allow us to make more precise forecasts in both time and space for critical human activities and concerns such as travel, health, work, and safety. Imagine air travel where the crew has no idea of what hazards lay ahead; an urban environment where no one knows where an airborne toxic hazard is headed; a wildfire where the firefighting crews have no idea which way the wind is blowing or where the fire will move; and severe weather where a community has no warning of an impending tornado, hail storm, or flash flood. These are some of the reasons why Regional Modeling is important to society. As these models through research and development, become more skilled at higher and higher resolution and gain the capability of replicating increasingly complex weather phenomena, the public, through the predictions of the National Weather Service, will be better served through more precise weather predictions for places and times where you are.
To What Phenomena Do We Apply Regional Modeling?
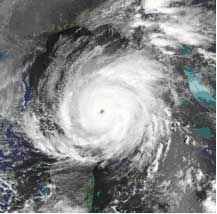
Regional modeling allows us to predict weather phenomena that present grave hazards to society. High on the list are hurricanes, ocean-going tropical storms that threaten coastal areas with high winds, heavy rain and storm surge. It is necessary to use regional modeling with hurricanes because to model the inner structure of the storm requires high resolution grids. Often the domain we define for the model may move along with the hurricane.
Severe thunderstorms are another focus area. Thunderstorms when the environmental conditions are right, turn severe, producing tornadoes, large hail, high winds, and heavy, flash-flood producing rains. Regional models are just attaining the capability of providing individual storm forecasts to better predict track and evolution. A major application is in air travel where thunderstorms present a dangerous threat to safe transport.
Winter weather, while often resolvable with coarse grid models, can be more accuately predicted with a regional modeling approach. Regional models are better able to define the boundaries of snow, sleet, freezing rain, and rain; determine more precisely where aircraft may encounter icing conditions or where transport on roads may be unwise.
Urban environments that may have extensive industrial areas and roads with attendant air pollution sources, also require regional models to accurately represent pollution generation, transport, dispersion, and chemical evolution.
Compared to weather systems, fires are much smaller in horizontal extent and thus monitoring of fire weather requires a regional approach to modeling. The fire itself may only cover an area of 1 to 100km2 but the weather influencing the fire operates in an area 100 to 1000 times larger. Fires are heavily controlled by regional weather, erupting with a sudden increase in winds, plunging relative humidity or soaring temperatures.
Another use for regional models is to evaluate how global climate change will impact a specific area. Here the regional model is nested in a climate model and run until a clear picture results for how temperature, humidity, precipitation, winds, and soil moisture may be impacted years to decades into the future. While this does not provide day–to-day forecasts, it allows planners to assess major environmental trends for use in urban planning, water, and agricultural management.
An important function of regional modeling is to assess the impact of new data sets on weather predictions. For example, as new radar systems evolve that tell us not only where it is raining but how the winds are blowing, it is important that before we make large government investments for deployment, we prove that better forecasts result. Assessment-of-impact seeks to determine the balance between societal costs and public safety.
Other uses for regional modeling might be considered mundane: more accurate prediction of sea breezes, cloud (ceiling), high and low temperatures, heat indices, and others.

What Answers are We Seeking?
There are so many regions on earth each with unique atmospheric phenomena that impact human activity the list here could be endless. However we will try to highlight a few efforts underway at ESRL.
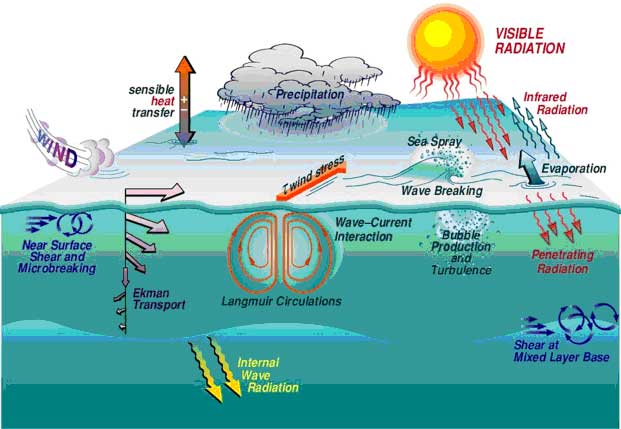
- An effort underway at PSD seeks to understand how oceans impact the atmosphere, specifically how oceans can influence the energy budget of hurricanes through heat transfer, wind stress due to waves, sea spray, formation of warm water areas, and the impact of precipitation on water temperature. General areas of investigation are solar and infrared radiation, precipitation and evaporation, ocean circulations, waves and wave breaking, and winds.
- Another PSD regional modeling effort is aimed at diagnosing and predicting air flows in constrained valley regions to assess pollution transport. Here the focus is the Central Valley of California on 4 Aug 2000 where strong flow from San Francisco Bay enters the valley west of Sacramento and takes very complex air flow routes throughout the valley. Patterns here include down valley jets, convergence and divergent areas, and wind spirals. The red lines show flow aloft while the black arrows show winds at the surface. Areas of wind spirals indicate where pollutants may be concentrated.
- GSD uses regional modeling to produce air quality forecasts using a model with complete air chemistry to gauge how pollutants interact and evolve with solar radiation, atmospheric moisture, and interactions with other constituent gasses and pollutants. The process starts with weather data analysis input into a forecast model. The predictions of winds and other variables then drive the air quality model that takes into account pollution sources both biogenic and anthropogenic (human-caused), and removal processes, leading to forecasts of air quality days in advance.
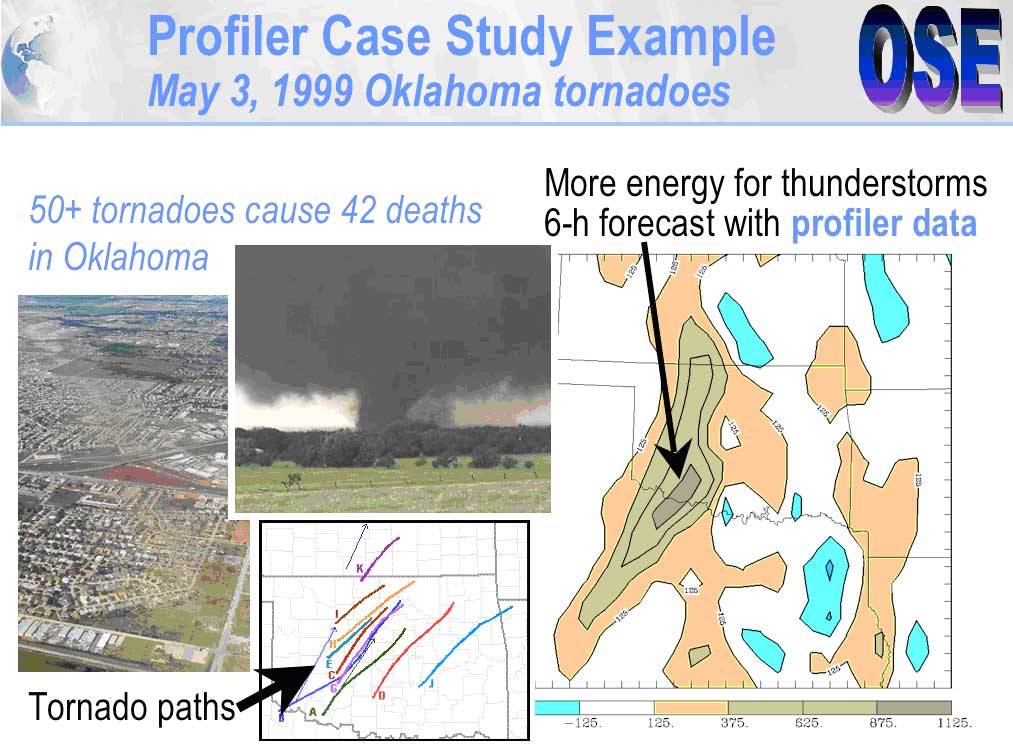
- Regional models are used to conduct Observation System Evaluations (OSE) where model forecasts are run with and without a potential new data source. Here in a study done by GSD for the May 3, 1999 tornado outbreak in Oklahoma, atmospheric wind profiler data is assimilated for one forecast and not assimilated in another. When the two are compared the energy for thunderstorm development is enhanced with the new data. Forecasters using this product are able to anticipate hours in advance where thunderstorms and attendant tornadoes are likely to form and move. Largely through assessment studies like this, a Doppler-radar wind profiler network has been transitioned to the National Weather Service as a new observing capability.
- The only thing better than running a regional model once is running it many times. Like gathering a health opinion from a group of doctors, multi-model ensemble runs allow us to not only obtain quantitative precipitation predictions but also uncertainty in those predictions. In the figures above generated by research work at GSD are shown probabilities of rainfall amounts 0.25, 0.50, 1.0, and 2.0 inches for a field experiement in central California and the Sierra Mountains. Note that we have over 90% confidence of 0.25 to 1 inch over a good share of the area. Two inch amounts (lower right figure) have only about 70% to 90 percent probabilities In an area located in the upper center. The actual rain is shown on the far left, indicating these high probabilities were warranted. Probabilistic forecasts are most useful where risk-based decisions must be made for economic reasons.

- Probabiistic forecasts are appropriate for planning travel, specifically air routing. In another application by GSD an ensemble is used to determine the probability of thunderstorms over the southeast US. Probabilities above 50% captured a good share of the convective storms determined by radar. Air carriers are more and more interested in probabilistic forecasts for optimizing decision making.
- Regional models may be applied to climate assessment. In this study by PSD and GSD, climatologists want to assess the impact of a warmer Gulf of Mexico (predicted by global climate models) and determine the impact on warm season (July) precipitation over the central US. The top figure shows the warmer Gulf waters. As air flows off the Gulf it has higher water content. The lower figure shows the impact on warm season precipitation. The warmer colors (yellow, red) indicate 50 to 150% more precipitation. This impacts the south central Great Plains and the Ohio River Valley across IL, IN, OH and WV. Cooler colors show where precipitation may be much less: SC and FL in ND, MN, and WI. Most of the US is not impacted (light and medium green). Water managers may use this information for long term planning and reservoir management.
What is NOAA’s Role in Regional Modeling?
NOAA’s charge is to predict changes in the Earth’s environment….to meet our societal, economic and environmental needs. As we have explained predictions at finer and finer resolution address the needs of individuals far more effectively. Precise predictions of hurricane tracks and intensity; heavy rain; severe storms; fire weather; air quality and chemistry, and climate change address societal challenges that include disaster mitigation, economic decision making, health concerns, travel and workplace safety, long range planning, and day to day decisions (an umbrella or a heavy coat, for example). Much of the work at ESRL finds its way into the published scientific literature and sophisticated weather systems implemented by the National Weather Service and many other government agencies like DOD, NASA, DOI, and the private sector.
What are the benefits to Society?
Improved understanding of regional weather systems and better predictions have obvious benefits. Imagine knowing how your city or state will cope with drier and warmer conditions over the next 30 years; imagine getting a tornado warning an hour in advance providing an opportunity to get your family properly sheltered; imagine being able to evacuate only those coastal residents that will be directly impacted by a hurricane and not unnecessarily clearing hundreds of miles of the coast; imagine being able to tell a fire incident manager where the fire front will be in 6 hrs; imagine airline routing system that knows where a squall line will be in 12 hrs and the resulting efficiency in airport acceptance rates; or imagine air quality predictions that would allow the time for special precautions to be taken for those at risk. Through a broadly themed and concentrated research and development effort, these imaginings are being turned into realities at ESRL.