How To... - Interpret Data - What
Example of Standardization of State Prevalence to National Race/Ethnic Distributions
Background
The prevalence of overweight for children birth to 5 years of age is
13.2% for a state WIC program and this is similar to the national PedNSS prevalence of
12.8%. However, the race/ethnic distribution for the state WIC program is
considerably different from the national race/ethnic distribution. For
example, the national PedNSS has a higher proportion of Hispanic children,
31.7% compared to 12.6% in the state WIC program.
In this example, the state WIC program wants to know how their prevalence
of overweight would change if they had the same race/ethnic distribution
as the national PedNSS data.
Standardization is a technique used to make a
population comparable to another population on a specific demographic characteristic thus,
making the prevalence of the health indicator of interest also comparable.
In this example, standardization allows you to determine what the prevalence of overweight for
children in the state WIC program would be based on the race/ethnic
distribution of the national PedNSS population. Therefore, the state
prevalence of overweight will be standardized based on the race/ethnic
distribution of the nation using the following formula.
Standardization Formula
Σ (A × B) = Standardized
Rate or Adjusted Prevalence
Σ is the sum of A
(proportion of the characteristic in the standard population) multiplied
by B (population characteristic specific prevalence of health
indicator) and equals the standardized rate or adjusted prevalence.
Calculation
The following table will be used to calculate the state standardized or
adjusted prevalence of overweight based on the race/ethnic distribution of
the nation.
Race/Ethnic
Group |
Race/Ethnic Distribution Nation (Standard)
A
Source: Table 1D |
State Race/Ethnic Specific Overweight
Prevalence
(%)
B
Source: Table 8C |
A × B |
|
White |
|
|
|
|
Black |
|
|
|
|
Hispanic |
|
|
|
Native
American |
|
|
|
Asian/Pacific
Islander |
|
|
|
|
Other |
|
|
|
|
Adjusted 1992 Prevalence Sum |
|
|
Step 1
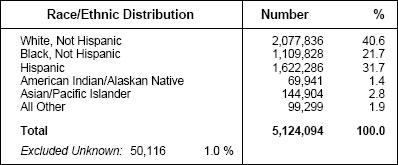
From PedNSS Table 1D, Summary of Demographic Indicators, obtain
the national distribution of race/ethnicity and list the percent as
decimal values defined as “A” in the table.
Sample: PedNSS Table 1D, Summary of Demographic Indicators
|
Race/Ethnic
Group |
Race/Ethnic Distribution Nation (Standard)
A
Source: Table 1D |
|
White |
.406 |
|
Black |
.217 |
|
Hispanic |
.317 |
Native
American |
.014 |
Asian/Pacific
Islander |
.028 |
|
Other |
.019 |
|
Step 2
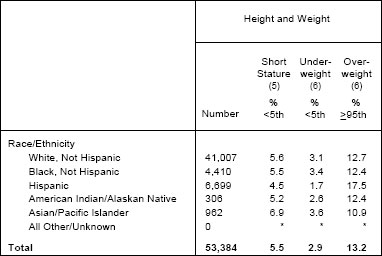
From PedNSS Table 8C, Growth and Anemia Indicators By
Race/Ethnicity or Age, obtain the race/ethnic specific prevalence of
overweight for the state WIC program and list the prevalence defined as
“B” in the table.
Sample: PedNSS Table 8C, Growth and Anemia Indicators
By Race/Ethnicity or Age
Race/Ethnic
Group |
Race/Ethnic Distribution Nation (Standard)
A
Source: Table 1D |
State Race/Ethnic Specific Overweight
Prevalence
(%)
B
Source: Table 8C |
|
White |
.406 |
12.7 |
|
Black |
.217 |
12.4 |
|
Hispanic |
.317 |
17.5 |
Native
American |
.014 |
12.4 |
Asian/Pacific
Islander |
.028 |
10.9 |
|
Other |
.019 |
0 |
|
Adjusted 1992 Prevalence Sum |
|
Step 3
Multiply the proportion for each race/ethnic group for the
nation (A) by the state overweight prevalence for each
corresponding race/ethnic group (B); the sum of the product of
A × B for each race/ethnic group is the adjusted prevalence for
overweight for the state. The table below shows this calculation for
each race/ethnic group.
Race/Ethnic
Group |
Race/Ethnic Distribution Nation (Standard)
A
Source: Table 1D |
State Race/Ethnic Specific Overweight
Prevalence
(%)
B
Source: Table 8C |
A × B |
|
White |
.406 |
12.7 |
5.16 |
|
Black |
.217 |
12.4 |
2.69 |
|
Hispanic |
.317 |
17.5 |
5.55 |
Native
American |
.014 |
12.4 |
.17 |
Asian/Pacific
Islander |
.028 |
10.9 |
.31 |
|
Other |
.019 |
0 |
0 |
|
Adjusted 1992 Prevalence Sum |
13.9 |
|
Summary
The adjusted prevalence for overweight for the state WIC program is
the prevalence if the race/ethnic distribution in the state WIC program
had been identical to that of the national PedNSS. The state race/ethnic
adjusted prevalence of overweight is 13.9%, higher than the state’s
original prevalence of 13.2% and the national PedNSS prevalence of
12.8%.
If we had not standardized the state prevalence we would have
concluded that the state prevalence of 13.2% was slightly higher (0.4%)
than the national prevalence (12.8%), when in fact, the race/ethnic
adjusted prevalence of 13.9% is 1% higher than that of the nation.
Therefore, if the state actually had the same race/ethnic distribution
as the nation, the adjusted prevalence of overweight (13.9%) in the
state would be higher than the original state prevalence (13.2%) indicates.
back to top
|