|
|
|
| A Framework for Projecting Interest Rate Spreads and Volatilities January 2000 |
Although the Congressional Budget Office has routinely
projected interest rates on Treasury bills as part of its economic and
budget outlook, it has not ordinarily projected commercial paper rates
or the London interbank offer rate. With the rate on three-month commercial
paper replacing the Treasury bill rate as the benchmark in the student-loan
program for the next 42 months, CBO will make projections about the behavior
of the new reference rate as part of its outlook. In developing a framework
for those projections, plausibility and consistency with CBO's current
projection procedures should be guiding principles. CBO formulated its
model for projecting interest rate spreads on that basis. After using the
model to produce cost estimates for the alternative-rate proposals considered
in 1997, CBO has since revised it to incorporate more recent economic data
and trends.
CBO'S INITIAL ALTERNATIVE-RATE PROJECTIONS
CBO's model for projecting interest rates on commercial paper and London interbank dollar deposits builds on work for its annual economic and budget outlook, which CBO prepares at the beginning of the year and updates at midyear. The outlook's horizon is 10 years; it comprises a short-term projection, or forecast, for a two-year span and a medium-term projection for the remaining eight years.(1) Over the medium term, CBO attempts to approximate average, or trend, relationships rather than project cyclical movements. Nevertheless, its projections take into account the possibility of booms and recessions. To identify trends, analysts use historical data for such factors as the growth of the labor force, the rate of national saving, and the growth of productivity. For Treasury interest rates, CBO bases its projections on underlying trends of real (inflation-adjusted) interest rates and inflation. The projections reflect CBO's baseline figures for government borrowing.
In 1997, CBO projected interest rates on commercial paper and the London interbank offer rate when they were first proposed as alternatives to Treasury bill rates in federal student-loan formulas. Over the projection period, analysts assumed that rates on commercial paper and LIBOR adjusted gradually to levels determined by their historical average spreads, which were calculated against Treasury bill rates using data from the early 1970s to late 1997. As discussed earlier, that period encompassed many shocks that had dissimilar effects on commercial paper and LIBOR spreads.
The Asian financial turmoil of 1998 suggested that CBO needed to augment
the approach it took in 1997 for projecting the two alternative-rate spreads.
During the crisis, spreads rose sharply but not by as much as during the
1970s to mid-1980s. The weaker hike in 1998 partly reflects the structural
changes mentioned earlier (for example, lower inflation) that have encouraged
integration of the two segments of the money market. But the spreads' smaller
expansion in 1998 also reflects the confluence of favorable cyclical conditions.
Following some difficulties in the early 1990s, industrial corporations
and financial institutions, as well as the governments of the United States,
the United Kingdom, and Western Europe, had come a long way by 1998 toward
rebuilding their finances after the turbulence of the 1970s and 1980s.
When they went to borrow in the commercial paper and London interbank markets,
their improved balance sheets spurred lenders to offer them roughly similar
credit-risk and liquidity premiums. Yet as noted earlier, participants
in the money markets have not always faced similar premiums. Recognizing
the need to factor in as much information as possible, CBO determined that
its projections must make some allowance for cyclical circumstances that
might have disparate effects on the commercial paper and London interbank
markets.
CBO'S CURRENT MODEL FOR PROJECTING INTEREST RATE SPREADS
CBO's modeling of the future paths of the alternative rates uses the baseline projections of three-month Treasury bill rates developed for the economic and budget outlook as its core, together with assumptions about certain factors that can affect the direction of those paths. The model projects spreads between Treasury bill rates and the alternative rates as a function of such factors as the rate of inflation and the stance and stability of monetary policy. (Those "determining" factors are also known as explanatory variables.) As discussed in Chapter IV, CBO then uses the baseline spread equations of the model to estimate volatilities for the spreads. The model specifies interest rates as bond-equivalent yields, which requires adjusting yields quoted from the original sources for differences in maturity and type of instrument. The adjustments are necessary because London interbank dollar deposits pay explicit interest computed over the term of the deposit, whereas Treasury bills and commercial paper are discount instruments. That means they pay interest implicitly--by selling at a discounted price relative to the price at which they are redeemed at maturity.
Factors That Determine How Spreads Behave
Modeling in full the way spreads between interest rates on three-month Treasury bills and rates for the alternative instruments widen and narrow over time would require an almost limitless set of determining factors. But fewer variables, four of which are among the most important, can explain the broad aspects of the spreads' movements:
Historical Period
In estimating the relationship between interest rate spreads and the determining factors, CBO used historical data from 1971 to 1998. That span takes in diverse patterns for interest rates, varying levels of inflation, differences in the stance and volatility of monetary policy, and the shifting credit risks of the banks and corporations that participate in commercial paper and interbank markets. The diversity provided a reasonable test of the usefulness of CBO's framework for projecting spreads.
Yet at the same time, using that long a span of data requires analysts to account for structural changes that have influenced the spreads' behavior and especially their volatility. The economy's overall improvement in the 1990s is the most significant structural change affecting interest rate spreads. Compared with the 1970s and 1980s, inflation has subsided, interest rates have declined, large federal deficits have disappeared, and monetary policy has been relatively stable. Those improvements helped narrow interest rate spreads during the 1990s, and CBO has incorporated those structural changes into its projections. Thus, in the model, inflation and interest rates remain lower than in the past, the federal budget shows a surplus, and monetary policy reflects the improved economic outlook. The result is smaller projected commercial paper and LIBOR spreads (measured against three-month Treasury bills) compared with spreads from the early 1970s to the mid-1980s. In CBO's estimates, spreads between commercial paper rates and LIBOR also narrow--for as long as the economy's overall improvement is expected to hold.
Why the spreads' volatilities have lessened is still unclear, even after
taking into account the role played by the determining factors. To economic
statisticians, the unexplained portion of the observed change in volatility
is a condition called heteroskedasticity. Its presence suggests that volatility
has changed in response to some underlying factor or set of factors. To
account for that change, CBO's model uses a procedure that gives relatively
less weight to data from periods when volatility is great (and the spreads
are large) and relatively more weight to data from times when volatility
is less (see Table 7). Smoothing the volatility in that way reduces the
influence of extreme, chaotic factors, such as the oil price shocks that
occurred in the 1970s, and yields a more accurate estimate. (For more details
of the weighting procedure, see the appendix.)
|
TABLE 7. CBO'S WEIGHTING OF DATA PERIODS TO ADJUST FOR CHANGES IN THE VOLATILITY OF INTEREST RATE SPREADS FOR COMMERCIAL PAPER AND LONDON INTERBANK DOLLAR DEPOSITS (In percent, by maturity) |
|||
|
Weighting
|
|||
| Spreada | 1971-1984 | 1985-1998 | |
|
|
|||
| Commercial Paperb | |||
| One month | 38 | 62 | |
| Three months | 41 | 59 | |
| London Interbank Dollar Depositsc | |||
| One month | 35 | 65 | |
| Three months | 36 | 64 | |
| Memorandum: | |||
| Equal Weighting (For comparison) | 50 | 50 | |
|
|
|||
| SOURCE: Congressional Budget Office. | |||
| a. Spreads (the differences between rates) are computed against the rate for three-month Treasury bills. Interest rates have been converted to bond-equivalent yields. | |||
| b. Short-term debt issued by financial companies. | |||
| c. The rate used is LIBOR--the London interbank offer rate. | |||
|
|
|||
Adjusting the model for the change in volatility achieves two objectives. First, it allows analysts to use a sufficiently long historical sequence to detect the role played by each determinant of a spread. (Another approach would have been to discard data when volatility was substantial, but that would needlessly throw away valuable information and prevent a more complete understanding of a spread's behavior.) Second, as explained in Chapter IV, accounting for the decline in volatility with such procedures improves estimates of the probability distribution of the range of variation in the spreads.
Illustrative Projections
CBO conducted an exercise to illustrate its approach for projecting the approximate behavior of interest rate spreads. As explanatory variables, CBO used interest rates on three-month Treasury bills; the yield curve spread, measured by the difference between rates on 10-year Treasury notes and three-month Treasury bills; inflation, measured by the percentage change in the consumer price index (specifically, the index for all urban consumers, or CPI-U); and monetary policy volatility, measured as the volatility of the federal funds rate. Projections of Treasury bill rates, the yield curve spread, and CPI-U inflation were based on CBO's December 1998 baseline. As noted earlier, the 1990s have seen much less volatility in monetary policy than in the past. Including the volatility of the federal funds rate as a factor thus assumes that monetary policy and the economy will remain relatively stable. Although the same determining factors were used throughout the exercise, the factors' effects can be expected to differ according to the spread being considered and the alternative instrument's maturity (whether one month or three months). All of the interest rate spreads discussed below were calculated against the three-month Treasury bill.
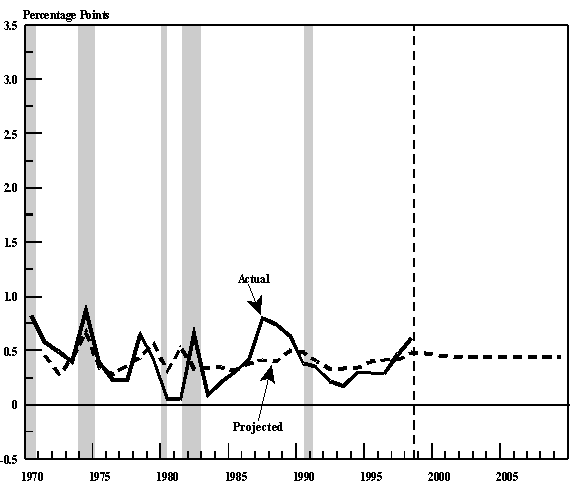
One-Month Commercial Paper. The results from CBO's model for
the one-month commercial paper spread appear satisfactory for two reasons
(see Figure 8). First, for the 1971-1998 period, the model's estimate of
the spread as a function of the determining factors tracks reasonably closely
with the actual spread during that time. Second, the projected spreads
for 1999 to 2009 move much closer to the average of the 1985-1998 period
than to the average of the earlier period, which indicates that the model's
projections are consistent with the economy's overall expected improvement.
|
FIGURE 8. ACTUAL AND PROJECTED INTEREST RATE SPREADS FOR ONE-MONTH COMMERCIAL PAPER |
 |
|
|
| SOURCES: Actual values are Congressional Budget Office calculations based on data from the Board of Governors of the Federal Reserve. Projected values are derived from CBO's model for estimating alternative interest rates for the federal student-loan program. |
| NOTES: Spreads (the differences between rates) are computed against the rate for three-month Treasury bills. Interest rates have been converted to bond-equivalent yields. |
| Commercial paper is defined here as short-term debt issued by financial companies. |
|
|
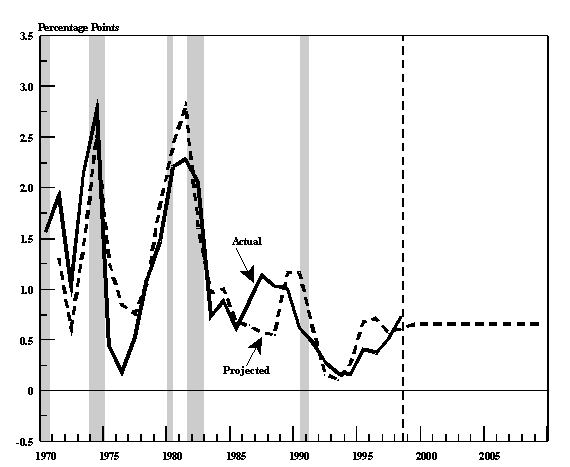
Three-Month Commercial Paper. In the past, the average for the
three-month commercial paper spread was less than that for the one-month
spread; however, in CBO's model, projections of the three-month spread
for 1999 to 2009 are slightly above the historical average and close to
recent experience (see Figure 9). The spread's stability reflects the lack
of economic shocks during the projection period in contrast to the mid-1970s
and early 1980s, when sudden economic jolts drove one-month commercial
paper rates to much higher levels than rates on three-month commercial
paper.
|
FIGURE 9. ACTUAL AND PROJECTED INTEREST RATE SPREADS FOR THREE-MONTH COMMERCIAL PAPER |
 |
|
|
| SOURCES: Actual values are Congressional Budget Office calculations based on data from the Board of Governors of the Federal Reserve. Projected values are derived from CBO's model for estimating alternative interest rates for the federal student-loan program. |
| NOTES: Spreads (the differences between rates) are computed against the rate for three-month Treasury bills. Interest rates have been converted to bond-equivalent yields. |
| Commercial paper is defined here as short-term debt issued by financial companies. |
|
|
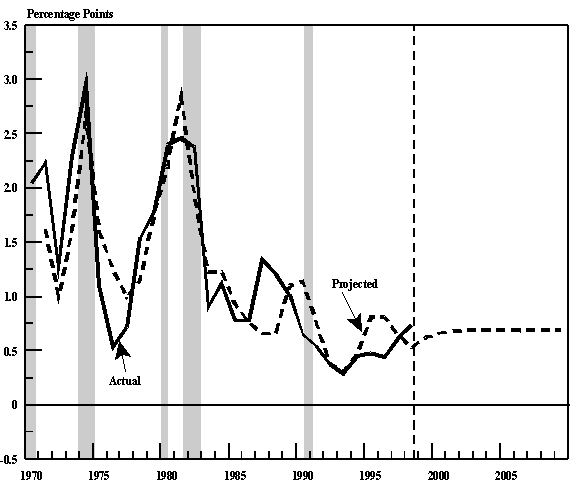
One-Month LIBOR. The model's results for the one-month LIBOR
spread show that CBO's approach can explain the spread's historical behavior,
including the narrowing described earlier (see Figure 10). The determining
factors affect LIBOR spreads differently from commercial paper spreads.
For example, fluctuations in three-month Treasury bill rates influence
the one-month LIBOR spread more strongly than the commercial paper spread,
probably because interbank premiums for credit and liquidity risks are
more influenced by overall movements in interest rates. A steep yield curve
also affects the LIBOR spreads more than the commercial paper spreads,
suggesting that an easier monetary policy influences the interbank market
more than the market for commercial paper. Furthermore, high levels of
inflation and more volatility in monetary policy have stronger effects
on credit-risk premiums in interbank markets. But the model also projects
future LIBOR spreads that are much lower than in the past. Those lower
spreads stem from CBO's baseline assumptions of lower overall rates of
interest and inflation and a stable monetary policy.
|
FIGURE 10. ACTUAL AND PROJECTED INTEREST RATE SPREADS FOR ONE-MONTH LONDON INTERBANK DOLLAR DEPOSITS |
 |
|
|
| SOURCES: Actual values are Congressional Budget Office calculations based on data from the Board of Governors of the Federal Reserve. Projected values are derived from CBO's model for estimating alternative interest rates for the federal student-loan program. |
| NOTES: Spreads (the differences between rates) are computed against the rate for three-month Treasury bills. Interest rates have been converted to bond-equivalent yields. |
| The rate on London interbank dollar deposits is known as LIBOR--the London interbank offer rate. |
|
|
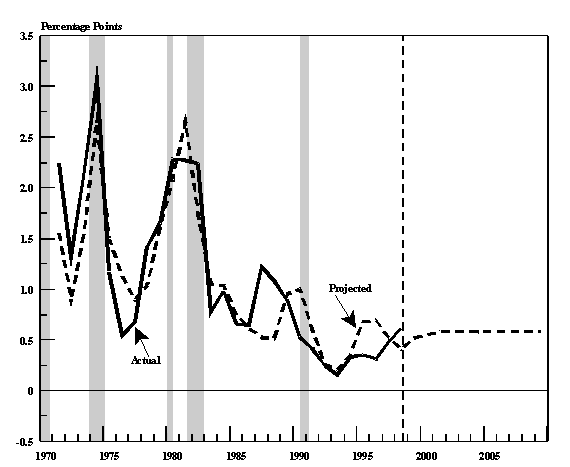
Three-Month LIBOR. CBO's model produced three-month LIBOR spreads
that are quite similar to those described above for one-month LIBOR (see
Figure 11). The determining factors appear to account for the broad movements
of the spread over all three decades--the 1970s, 1980s, and 1990s--which
in turn suggests why LIBOR spreads were wide before the 1990s and why they
have not only narrowed in this decade but also come close to commercial
paper spreads. The determining factors also lead to narrow projected spreads
for the decade ahead--as long as the CBO economic outlook remains favorable.
|
FIGURE 11. ACTUAL AND PROJECTED INTEREST RATE SPREADS FOR THREE-MONTH LONDON INTERBANK DOLLAR DEPOSITS |
 |
|
|
| SOURCES: Actual values are Congressional Budget Office calculations based on data from the Board of Governors of the Federal Reserve. Projected values are derived from CBO's model for estimating alternative interest rates for the federal student-loan program. |
| NOTES: Spreads (the differences between rates) are computed against the rate for three-month Treasury bills. Interest rates have been converted to bond-equivalent yields. |
| The rate on London interbank dollar deposits is known as LIBOR--the London interbank offer rate. |
|
|
Eurodollar Deposits. Closely associated with LIBOR are Eurodollar
deposit rates--the rates paid on deposits of dollar-denominated funds by
banks in London and in cities outside the United States to corporations
and other investors that are not part of the interbank community. Unlike
LIBOR, which is not published regularly or even frequently by the U.S.
government, estimates of Eurodollar deposit rates are available daily from
the Federal Reserve (for reference purposes only) on maturities of one,
three, and six months. Those estimates are bid rates for deposits in London.
Spreads between LIBOR and rates on Eurodollar deposits have tended to be
relatively narrow (see Table 8).
|
TABLE 8. AVERAGE INTEREST RATE SPREADS BETWEEN RATES ON LONDON INTERBANK DOLLAR DEPOSITS AND EURODOLLAR DEPOSITS (In percentage points, by maturity) |
|||
| Maturity | 1971-1998 | 1980-1998 | 1985-1998 |
|
|
|||
| One Month | 0.09 | 0.13 | 0.12 |
| Three Months | 0.09 | 0.13 | 0.12 |
|
|
|||
| SOURCE: Congressional Budget Office based on data from the Board of Governors of the Federal Reserve and the London Financial Times. | |||
| NOTES: Spreads (the differences between rates) are computed using interest rates converted to bond-equivalent yields. | |||
| The rate on London interbank dollar deposits is LIBOR--the London interbank offer rate. | |||
| Eurodollar deposits are dollar-denominated funds placed in banks in London and in cities outside the United States by investors that are not part of the interbank community. | |||
|
|
|||
One criterion for any benchmark rate for the student-loan program might
be whether the rates could be provided by the Federal Reserve. Consequently,
CBO developed equations to estimate the spreads between one-month and three-month
Eurodollar deposit rates and rates on three-month Treasury bills. In both
cases, the framework was the same as that used for the LIBOR spreads, and
the results were as satisfactory (see Figures 12 and 13).
|
FIGURE 12. ACTUAL AND PROJECTED INTEREST RATE SPREADS FOR ONE-MONTH EURODOLLAR DEPOSITS |
 |
|
|
| SOURCES: Actual values are Congressional Budget Office calculations based on data from the Board of Governors of the Federal Reserve. Projected values are derived from CBO's model for estimating alternative interest rates for the federal student-loan program. |
| NOTES: Spreads (the differences between rates) are computed against the rate for three-month Treasury bills. Interest rates have been converted to bond-equivalent yields. |
| Eurodollar deposits are dollar-denominated funds placed in banks in London and in cities outside the United States by investors that are not part of the interbank community. |
|
|
|
FIGURE 13. ACTUAL AND PROJECTED INTEREST RATE SPREADS FOR THREE-MONTH EURODOLLAR DEPOSITS |
 |
|
|
| SOURCES: Actual values are Congressional Budget Office calculations based on data from the Board of Governors of the Federal Reserve. Projected values are derived from CBO's model for estimating alternative interest rates for the federal student-loan program. |
| NOTES: Spreads (the differences between rates) are computed against the rate for three-month Treasury bills. Interest rates have been converted to bond-equivalent yields. |
| Eurodollar deposits are dollar-denominated funds placed in banks in London and in cities outside the United States by investors that are not part of the interbank community. |
|
|
Conclusion
The results from CBO's model indicate that with one exception, spreads
between interest rates on three-month Treasury bills and the rates on the
alternative financial instruments are narrow compared with past averages
(see the top panel of Table 9). The largest declines relative to the past
occur in LIBOR and Eurodollar spreads. The exception is the spread for
three-month commercial paper, which is projected to be slightly larger
than the spread for one-month commercial paper instead of slightly smaller,
as in the past.
|
TABLE 9. ILLUSTRATIVE PROJECTIONS OF SPREADS AND INTEREST RATES FOR SHORT-TERM FINANCIAL INSTRUMENTS USING CBO'S JANUARY 1999 ECONOMIC ASSUMPTIONS (By maturity) |
|||||||||||
| Average, 1971- 1998 |
Actual, 1998 |
1999 | 2000 | 2001 | 2002 | 2003 | 2004 | 2005 | 2009 | ||
|
|
|||||||||||
| Spreads (Percentage Points)a | |||||||||||
| Commercial Paperb | |||||||||||
| One month | 0.45 | 0.61 | 0.47 | 0.44 | 0.41 | 0.41 | 0.41 | 0.41 | 0.41 | 0.41 | |
| Three months | 0.41 | 0.61 | 0.47 | 0.46 | 0.44 | 0.44 | 0.44 | 0.44 | 0.44 | 0.44 | |
| London Interbank Dollar Depositsc | |||||||||||
| One month | 1.01 | 0.73 | 0.66 | 0.66 | 0.66 | 0.66 | 0.66 | 0.66 | 0.66 | 0.66 | |
| Three months | 1.19 | 0.73 | 0.62 | 0.66 | 0.68 | 0.69 | 0.69 | 0.69 | 0.69 | 0.69 | |
| Eurodollar Depositsd | |||||||||||
| One month | 0.91 | 0.61 | 0.49 | 0.51 | 0.51 | 0.51 | 0.51 | 0.51 | 0.51 | 0.51 | |
| Three months | 1.10 | 0.61 | 0.52 | 0.55 | 0.58 | 0.58 | 0.58 | 0.58 | 0.58 | 0.58 | |
| Interest Rates (Percent) | |||||||||||
| Three-Month Treasury Bills | 6.97 | 4.91 | 4.56 | 4.61 | 4.61 | 4.61 | 4.61 | 4.61 | 4.61 | 4.61 | |
| Commercial Paperb | |||||||||||
| One month | 7.42 | 5.52 | 5.03 | 5.06 | 5.02 | 5.02 | 5.02 | 5.02 | 5.02 | 5.02 | |
| Three months | 7.38 | 5.52 | 5.04 | 5.07 | 5.06 | 5.06 | 5.06 | 5.06 | 5.06 | 5.06 | |
| London Interbank Dollar Depositsc | |||||||||||
| One month | 7.98 | 5.65 | 5.22 | 5.28 | 5.27 | 5.27 | 5.27 | 5.27 | 5.27 | 5.27 | |
| Three months | 8.16 | 5.64 | 5.18 | 5.27 | 5.30 | 5.30 | 5.30 | 5.30 | 5.30 | 5.30 | |
| Eurodollar Depositsd | |||||||||||
| One month | 7.88 | 5.52 | 5.05 | 5.12 | 5.13 | 5.13 | 5.13 | 5.13 | 5.13 | 5.13 | |
| Three months | 8.06 | 5.52 | 5.08 | 5.17 | 5.19 | 5.20 | 5.20 | 5.20 | 5.20 | 5.20 | |
|
|
|||||||||||
| SOURCES: Congressional Budget Office using data from the Board of Governors of the Federal Reserve and the London Financial Times. Projections of Treasury bill rates are taken from Congressional Budget Office, The Economic and Budget Outlook: Fiscal Years 2000-2009 (January 1999). The projections of other rates are based on econometric models (see the appendix for further details). | |||||||||||
| a. Spreads (the differences between rates) are computed against the rate for three-month Treasury bills. Interest rates have been converted to bond-equivalent yields. | |||||||||||
| b. Short-term debt issued by financial companies. | |||||||||||
| c. The rate used is LIBOR--the London interbank offer rate. | |||||||||||
| d. Eurodollar deposits are dollar-denominated funds placed in banks in London and in cities outside the United States by investors that are not part of the interbank community. | |||||||||||
|
|
|||||||||||
Over the long run, why have the projected spreads fallen below their
historical averages in almost all cases? The main reason is CBO's economic
outlook for the next several years. Compared with historical trends, Treasury
bill rates are lower (see the bottom panel of Table 9). Furthermore, yield
curves are flatter, inflation rates are more modest, and the volatility
of the federal funds rate is assumed to be less (see Table 10). Those projected
improvements in the economic outlook feed directly into CBO's projections
of the spreads and help narrow them.
|
TABLE 10. AVERAGE LEVELS OF DETERMINING FACTORS USED IN CBO'S MODEL FOR PROJECTING INTEREST RATE SPREADS |
|||||
| Factor | 1971-1998 | 1999-2000 | |||
|
|
|||||
| Interest Rate on Three-Month Treasury Bills (Percent) | 6.97 | 4.61 | |||
| Treasury Bill Yield Curve (Percentage points)a | 1.41 | 0.75 | |||
| Inflation (Percent)b | 5.03 | 2.61 | |||
| Federal Funds Volatility (Percentage points)c | 1.14 | 0.72 | |||
|
|
|||||
| SOURCES: Congressional Budget Office using data from the Board of Governors of the Federal Reserve and the Department of Labor, Bureau of Labor Statistics. Projections are taken from Congressional Budget Office, The Economic and Budget Outlook: Fiscal Years 2000-2009 (January 1999). | |||||
| a. The yield curve is the relationship formed by plotting the yields of otherwise comparable fixed-income securities against their terms of maturity. | |||||
| b. As measured by the consumer price index for all urban consumers. | |||||
| c. Volatility is computed over the indicated period as the square root of the eight-quarter moving average of the squared deviation of the federal funds rate. Deviation is measured as the difference between the log first-difference change of the federal funds rate and the trend of the log first-difference change in the rate. Trend is measured as an eight-quarter moving average. | |||||
|
|
|||||
1. The two-year forecast describes the likely evolution of the business cycle and is usually similar to the Blue Chip consensus (an average of the forecasts produced by approximately 40 to 50 private-sector economists).