| NIDA NEWS |
|


|
|
Information reported at each CEWG meeting is distributed to drug abuse prevention and treatment agencies, public health officials, researchers, and policymakers. The information is intended to alert authorities at the local, State, regional, and national levels, and the general public, to the current conditions and potential problems so appropriate, timely action can be taken. Researchers also use this information to develop research hypotheses that might explain social, behavioral, and biological issues related to drug abuse. In addition to ongoing assessment of drug patterns and trends in the United States, the CEWG provides a forum for the discussion of drug patterns and trends in other areas and regions of the world. This meeting included presentations on drug abuse surveillance and other research in Canada, Malaysia, Mexico, and Thailand. Reports were presented by representatives of the United Nations Drug Control Programme (UNDCP) and the National Drug Intelligence Center (NDIC), Johnstown, Pennsylvania. In addition, preliminary research findings were presented by NIDA grantees conducting studies in the San Francisco area. Drug Abuse Highlights for the United StatesData from the 49th meeting of the CEWG portrayed the diversity of drug abuse patterns within and across CEWG areas, as well as changes in trends over time. Findings presented at the meeting are based primarily on 1998 and 1999 data and on comparisons of these data with those from earlier time periods. The major findings are highlighted below.
Cocaine/CrackMembers in 18 of the 21 CEWG areas reported a downward trend in cocaine/crack indicators, a trend attributed in part to the aging-out of crack abusers and the unpopularity of the drug among new and younger drug abusers. The downward trend in cocaine/crack indicators is most apparent in regions of the Nation where abuse has been most concentrated. New York is a case in point. While cocaine indicators in New York were high from 1996-99, the trend downward is striking, as indicated in the chart below.
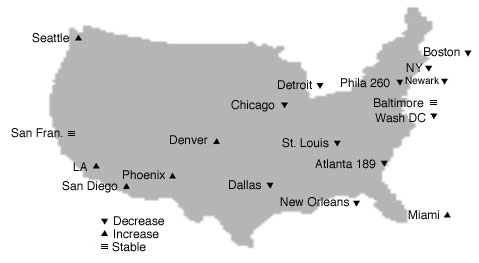
The variability of cocaine/crack indicators across CEWG sites is best illustrated by the map below. As shown, the highest rates (per 100,000 population) of cocaine ED mentions are more concentrated in northeast, mid-Atlantic, and (northern) Midwest regions of the Nation. These same areas tend to be those where cocaine ED mentions have decreased most dramatically. Findings on the downward trend in cocaine/crack indicators reported for CEWG areas included the following:
Comparisons of peak year versus 1999 rates of cocaine ED mentions show a decrease of between 13 and 41 percent in the CEWG areas listed below. (Peak years are outlined in black and all occurred before 1997.)
Decreases between peak years and 1999 in rates of cocaine ED mentions were relatively small in other CEWG areas: Chicago (8.9 percent, 1997 vs. 1999); Dallas (18.9 percent, 1998 vs. 1999); Philadelphia (5.5 percent, 1998 vs. 1999), St. Louis (4.9 percent, 1994 vs. 1999); and San Diego (13.7 percent, 1996 vs. 1999). From 1998 to 1999, estimated cocaine ED mentions decreased in 10 CEWG areas, increased in 7, and remained relatively stable in 3. The decreases were statistically significant in six CEWG areas: New York (24.3 percent), Boston (21.3 percent), Dallas (18.5 percent), Newark (16.5 percent), Washington, D.C. (15.3 percent), and New Orleans (10.7 percent). Mentions also decreased in Atlanta, Chicago, Detroit, and Philadelphia. At the same time rates of cocaine ED mentions were decreasing in some areas, they were increasing in others. The 1999 rates, per 100,000 population, of cocaine ED mentions reached their highest level in 4 years in five CEWG areas: Denver (87), Los Angeles (79), Miami (210), Minneapolis/St. Paul (34), and Phoenix (91). Estimated cocaine ED mentions across DAWN areas in 1999 decreased in two age categories: the 12-17 year-olds (25.4 percent) and the 26-34 year-olds (8.4 percent). Slight increases in mentions occurred in the 18-25 year-old age category (3.1 percent) and the 35 and older age category (2.6 percent). Of note is the fact that 71 percent of the 1999 cocaine ED mentions involved more than one drug, indicating that cocaine was typically used either sequentially or concurrently with other substances. The 1998 DAWN medical examiner data also point to a downward trend in cocaine abuse; this occurred in 15 CEWG areas. Nevertheless, cocaine was the drug most frequently reported by MEs in 1998, and was mentioned in 45 percent of the drug-related death cases. In the nine CEWG areas listed below, cocaine ranked first as a cause or contributor in drug-related deaths reported by MEs.
In another seven CEWG areas, cocaine ranked second as a cause or contributor in drug-related deaths: Baltimore (59 percent), Philadelphia (52 percent), San Francisco (49 percent), Phoenix (45 percent), Dallas (39 percent), Boston (39 percent), and Los Angeles (37 percent). In the 1999 ADAM data, the percentages of adult male arrestees testing positive for cocaine trended downward in 7 of the 16 sites where this population was tested: Chicago, Los Angeles, New Orleans, New York, Philadelphia, San Diego, and Seattle. The chart below illustrates the three areas with the largest percentage point decreases from 1997-99.
The percentages of adult male arrestees testing cocaine-positive increased in four CEWG areas (Dallas, Minneapolis, Philadelphia, and Washington, D.C.), and remained stable in the remaining five areas (Atlanta, Denver, Detroit, Miami, and Phoenix). In the 13 ADAM sites where adult females were tested in 1999 (N = 5,150 in CEWG sites), the percentages testing cocaine-positive showed a different trend from that of male arrestees (N = 15,748 across CEWG sites). While the number of females tested in each site were relatively small compared with the number of males tested, the percentages of females testing cocaine-positive actually increased in six sites. The following chart shows the four sites with the largest increases.
Increases in the other two sites were small (2.7 and 4.6 percentage points in New Orleans and Seattle, respectively). The percentages of adult females testing cocaine-positive remained relatively stable in five CEWG areas (Atlanta, Denver, Detroit, Philadelphia, and San Diego) and decreased in two. The decrease was substantial in Los Angeles (12 percentage points), but relatively small in New York (3.2 percentage points). In 13 ADAM sites where both males and females were tested in 1999, the percentages of females testing cocaine-positive exceeded those for males in all but one site (New Orleans, 2.4 percentage point difference). In four sites, the percentage point difference between females and males was small, ranging from 1 to 6.5 (Los Angeles, Dallas, San Diego, and Minneapolis). In another five sites, cocaine-positive females exceeded males by 10.4 to 18.9 percentage points (Denver, Atlanta, Phoenix, Seattle, and Detroit). The three sites with the largest percentage point differences between men and women are shown in the chart that follows.
An increase in the availability and use of cocaine hydrochloride (HCl) was reported in 6 CEWG areas: Denver, Detroit/Wayne County, New York, New Orleans, Philadelphia, and Seattle. A slight increase in cocaine indicators was reported for Los Angeles. Seattle reported a more substantial increase in cocaine indicators after several years of decline. Indicators stabilized in St. Louis. Cocaine is emerging as a significant problem along the Texas-Mexico border with high use seen in ADAM and school survey data. In addition, crack use in Atlanta is moving to rural areas outside the city. Indicators will continue to be closely monitored across CEWG areas for a possible resurgence of cocaine/crack abuse. HeroinAlthough heroin indicators vary across CEWG areas, they increased in 15 CEWG areas. Increases were reported in areas located in all regions of the Nation, as indicated in the examples below.
From 1998 to 1999, estimated heroin/morphine ED mentions increased overall by 4 percent across the 20 CEWG areas included in DAWN. The increases from 1998 to 1999 were statistically significant in five CEWG areas: Denver, Miami, New Orleans, St. Louis, and San Francisco. The greatest increase in heroin/morphine ED mentions occurred in the second half of 1999 when there was a 12 percent increase in heroin/morphine mentions compared with the first half of 1999. DAWN ED data suggest-as CEWG members have reported for several years-that heroin abuse is increasing among young populations. Of particular concern are the increases in heroin/morphine ED mentions in the 18-25 year-old population. The number of ED mentions in this young adult population steadily increased across DAWN areas from 1992 (5,860) to 1999 (15,132)-an increase of 158 percent. The estimated number of heroin/morphine ED mentions in the 18-25 year old age category increased 51.4 percent from 1997 to 1999, compared with a 20.5 percent increase in the number of heroin/morphine ED mentions in the 35 and older age category. The trend of increases in heroin abuse among younger populations continued to be reported by most CEWG members, as in the following examples:
Rates of heroin/morphine mentions per 100,000 population increased from 1998 to 1999 in 13 of the 20 CEWG areas; rates were stable in 4 areas and decreased in 3 areas. The rates of heroin/morphine ED mentions, per 100,000 population, were very high in 6 CEWG areas, ranging from 110 to 299 as shown in the table to the right: Heroin use indicators were stable in several areas, some with the high rates of ED mentions:
Decreases in heroin indicators were reported from only three CEWG areas: Dallas, Honolulu, and San Diego. Trend data from 1992 through 1999 show that the numbers and rates of heroin/morphine ED mentions stabilized in 8 CEWG areas, declined slightly in 2, and increased in 10. The chart below shows the increase in heroin/morphine mention rates for selected years in five CEWG areas with the most substantial increases.
The greatest increases in both the numbers and rates of heroin/morphine ED mentions were in Chicago and Miami, as shown in the chart that follows.
From 1992 to 1999 primary heroin treatment admissions in Chicago increased by 156 percent. Many varieties of heroin are available in Chicago, including South American, Southeast Asian, Southwest Asian, and Mexican. The 1998 DAWN data from medical examiners show that heroin/morphine accounted for the largest percentages of drug-related mentions in eight CEWG areas:
Areas with the highest number of heroin/ morphine-related deaths in 1998 were as follows:
Trend data from the DAWN ME system from 1995-98 show substantial increases over time in the number of heroin/morphine-related deaths in the five CEWG areas listed in the chart below.
The 1999 ADAM data show relatively high percentages of adult males and females testing positive for opiates, based on the EMIT test. The following chart shows the eight CEWG areas in which at least 10 percent of the adult male or female arrestees tested positive for opiates (i.e., heroin, morphine, codeine, and/or a semi-synthetic narcotic), indicating they had used opiates within at least the 3 days prior to testing.
From 1998 to 1999, opiate-positive rates for adult males remained relatively stable in 9 of the 16 areas where adult males were tested; the percentages increased in 4 and decreased in 3 areas. The percentages of opiate-positive tests increased in two areas where they had previously been very low: Atlanta (1.3 to 4.3) and Dallas (2.3 to 4.5). Comparable data from the 13 CEWG areas in which adult female arrestees were tested show a different pattern: the percentages of opiate-positives among women increased in eight CEWG areas, remained stable in three, and decreased in two. The largest increase was in Dallas (from 2.3 to 6.7 percent). Based on DEA's Drug Monitor Program data for January-March 2000, the purity of heroin tends to be higher in the northeast as indicated in the following chart.
Data sources show that heroin and cocaine are often used in combination (concurrently or sequentially). For example, it was reported that 60 percent of the heroin injectors who were admitted to treatment in Baltimore (1999) also injected cocaine. Heroin/morphine was present in 37 percent of the cocaine-positive toxicology reports (first half of 2000) in Philadelphia. In Washington, D.C. in 1999-2000, nearly three-fifths of primary heroin addicts in treatment reported cocaine/crack as a secondary drug. MarijuanaBetween 1990 and 1998, marijuana indicators increased dramatically in all CEWG areas for such reasons as the following:
From 1990 to 1998, estimated marijuana/hashish ED mentions increased steadily across all CEWG areas, with an overall increase of 328 percent. Marijuana/hashish ED mentions across CEWG areas increased only slightly from 1998 to 1999 (2.1 percent) but the increases were significant in both the 18-25 and 35 and older age categories. In 1999, marijuana/hashish ED mentions increased in 9 CEWG areas, decreased in 10, and remained stable in 1 (Newark). The increases were significant in three CEWG areas (Baltimore, Minneapolis/St. Paul, and Phoenix), whereas decreases were significant in three areas (Boston, New Orleans, and San Diego). The highest rates of marijuana/hashish ED mentions, per 100,000 population, in 10 years (to 1999) occurred in 8 CEWG areas: Baltimore (72 per 100,000), Denver (43), Los Angeles (64), Miami (67), Phoenix (50), and Washington, D.C. (65). However, the highest rates of marijuana/hashish ED mentions, per 100,000 population, were in 5 different CEWG areas:
The lowest rates of marijuana/hashish ED mentions in 1999 were in Minneapolis/St. Paul (26), San Francisco (29), and San Diego (38). The DAWN ED data show that marijuana/ hashish is more likely than other illicit drugs to be used either sequentially or concurrently with other drugs. Seventy-eight percent of the 1999 marijuana/hashish ED mentions involved other drugs. The drug groups mentioned most often with marijuana/hashish are shown below.
All of the above drug mentions represent increases from 1990 to 1999. However, during this time period, the two drugs that increased most in combination with marijuana/hashish were hydrocodone (from 8 in 1990 to 840 in 1999) and MDMA (from 8 to 796). In 1998, there were only 487 marijuana ME mentions in the 20 CEWG areas included in DAWN. As in the DAWN ED data, marijuana was frequently mentioned in combination with other substances. These included alcohol (36 percent of the ME marijuana mentions), cocaine (25.9 percent), and heroin/morphine (19.4 percent). The highest number of marijuana ME mentions were in Dallas (92), Detroit (61), New York (53), Philadelphia (47), and St. Louis (47). In the 1999 ADAM data on adult males, marijuana was the drug most frequently detected in 9 of the 16 CEWG sites reporting to ADAM. The percentages of males testing positive for marijuana ranged from 32.3 percent in Los Angeles to 47.9 percent in Detroit. Female adult arrestees were less likely to test positive for marijuana; the percentages ranged from 21 percent in Los Angeles to 34.1 percent in Denver. From 1998 to 1999, the two CEWG areas with the largest increases in marijuana-positives among adult male arrestees were Atlanta (18.4 percentage points) and Miami (7 percentage points). Among juvenile arrestees in 1999, marijuana was the most commonly used drug by both males and females in all ADAM sites. In the CEWG sites reporting to ADAM, more than half the juvenile males and almost 40 percent of juvenile females tested positive for marijuana. One issue raised by CEWG members is why primary marijuana treatment admissions are increasing while other marijuana indicators are decreasing or stabilizing. It was recommended that CEWG members examine this issue to determine whether referrals from drug courts and other criminal justice agencies account for treatment admission increases. It was also suggested that CEWG members determine the nature and extent of multiple drug use among primary marijuana treatment admissions. For example, in Dallas, some young marijuana abusers dip joints in embalming fluid containing phencyclidine (PCP) or in codeine cough syrup. MethamphetamineThere are indications that methamphetamine abuse is rising after a 2-year decline, and that use of the drug continues to spread to areas outside the west coast and southeast where abuse is most concentrated:
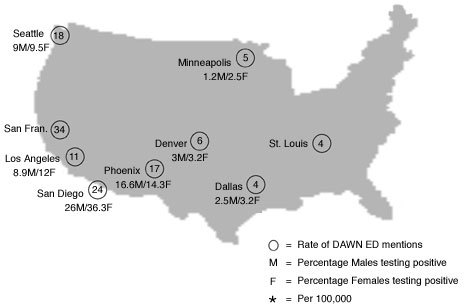
Other indicator data support the potential increase in and spread of methamphetamine abuse, as in the ED data cited below. Between 1997 and 1998, the number of methamphetamine ED mentions dropped dramatically in CEWG areas, from 5,536 to 3,627. The last half of 1998 represented a 30 percent decrease compared with the first half of 1998. The first half of 1999 differed very little from the last half of 1998 (1,504 vs. 1,490), suggesting a decline in methamphetamine abuse. However, in the last half of 1999, there was an upsurge in methamphetamine ED mentions (n = 1,902) in CEWG areas, a 26.5 percent increase over the first half of 1999. Increases in methamphetamine ED mentions in the second half of 1999 were significant in nine CEWG areas, including four on the west coast that have the highest rates of methamphetamine ED mentions (San Diego, San Francisco, Los Angeles, and Seattle). The increase also was significant in two southwest areas with high methamphetamine ED rates (Denver and Phoenix). DAWN ME methamphetamine mentions in 1999 were concentrated in the CEWG areas with the highest rates of ED mentions (per 100,000 population): Los Angeles (111), San Diego (84), Phoenix (60), and San Francisco (45). Of the CEWG areas included in ADAM, San Diego reported the highest percentage of adult male (26 percent) and female (36.3 percent) arrestees testing positive for methamphetamine in 1999 (see map below). Of even greater concern is that 15.8 percent of juvenile male and 18.2 percent of juvenile female arrestees tested positive for methamphetamine in San Diego. Among the arrestees in San Diego, 22 percent of the Hispanic juvenile males and 16.7 percent of Hispanic adult females tested positive for methamphetamine in 1999. In 1999, only four CEWG areas reported methamphetamine rates above 3 percent for male or female arrestees, respectively: San Diego (as noted above), Phoenix (16.6 and 14.3 percent), Los Angeles (8.9 and 12 percent), and Seattle (9 and 9.5 percent). It was reported in 11 CEWG areas that methamphetamine is used together with other drugs at raves. Ethnographers reported that Viagra is being used with methamphetamine and other drugs, sometimes with fatal consequences. Methamphetamine indicators continue to be closely monitored in areas that have not reported serious methamphetamine use problems in the past. It was estimated that as many as 50 methamphetamine labs will be seized in Michigan in the year 2000. In the Minneapolis/St. Paul CEWG area, 119 methamphetamine labs were reportedly dismantled in the year 2000 through October.
MDMA (Ecstasy)Information from a variety of sources indicates that MDMA (ecstasy) has become more available, and that use has been increasing in most CEWG areas. The price per pill or dosage unit varies slightly across CEWG sites, as in the ex-amples below:
Recent surveys conducted in Massachusetts and Seattle shows that lifetime ecstasy use is increasing in young populations. The Massachusetts school survey shows that ecstasy use increased sharply among high school students, from 6 percent in 1996 to 15 percent in 1999. A survey of patients in the Stonewall Recovery Services Program in Seattle, conducted from February to July 2000, showed that 44 percent of the younger patients (age 14 to 24) and 43 percent of the patients age 25 and older had used ecstasy at some point in their lives. It was reported in 17 CEWG areas that ecstasy use has become more widespread, and that the drug is being used in settings other than night-clubs and rave dance parties.
DAWN 1999 data show that MDMA is used by many marijuana users. ED mentions of MDMA in combination with marijuana/hashish increased from 8 in 1990 to 796 in 1999. Emerging DrugsIndicator data show that several controlled narcotics are being abused by greater numbers of people in CEWG areas. These include hydrocodone (e.g., Lorcet, Lortab, Vicodin), hydromorphone (e.g., Dilaudid), and oxycodone (e.g., Percodan, Percocet). Abuse of clonazepam, a benzodiazepine, is increasing also. Increases in three emerging drugs are revealed in the DAWN ED data, as shown below. The largest increase from 1993-99 is for hydrocodone (189 percent).
These drugs are among those increasingly used in combination with marijuana/hashish; the percentage increase from 1990 to 1999 is presented in the following chart.
Abuse of one or more of these drugs was reported in five CEWG areas:
International HighlightsCanadaThe Canadian Community Epidemiology Network on Drug Use (CCENDU), established in 1995 and modeled on the CEWG, continues to coordinate and facilitate the collection, organization, and dissemination of quantitative and qualitative information on substance abuse. Currently, 11 sites participate in the CCENDU and 3 others are in development. In recent years, funding limitations have hindered the conduct of surveys and accessing and reporting data. Findings from a sample of CCENDU sites show that alcohol continues to be the major substance abuse problem in Canada. However, use of illicit drugs has been increasing. Cocaine/crack use is one-third lower than in the United States. Increases in numbers of AIDS (acquired immunodeficiency syndrome) cases and cases of other communicable diseases associated with injection drug use have decreased in Canada. At the same time, cases of hepatitis C are rising, raising in-creased concern because of the long latency period of the disease. Ecstasy is a recurring theme in all CCENDU sites, and reportedly is increasing in Calgary where the economy is "booming." Children as young as 12 are said to be using ecstasy. Cocaine/crack indicators also have been increasing in Calgary. Ecstasy use is reportedly increasing in Winnipeg also, where alcohol is the most commonly abused substance and marijuana is the major drug of concern. Alcohol and marijuana use (particularly among youth) are also a major concern in St. Johns. In Vancouver, drug abuse continues to be a major public health problem. The drug epidemic is centered in the city's downtown Eastside area where there are high rates of overdose deaths and HIV (human immunodeficiency virus) associated with injection of heroin and cocaine. Over the past several years, about 2,000 cases of hepatitis C have been reported each year in Vancouver and Richmond. Currently, 3,403 patients are in treatment in methadone clinics in Vancouver, and 2,160 patients are being treated by private practitioners. Between 1995 and 1999, the number of cocaine offenses in Vancouver increased from 746 to 1,044, and heroin offenses increased from 201 to 302. However, marijuana offenses decreased from 503 in 1995 to 262 in 1999. The Royal Canadian Mounted Police have increased efforts to "crack down" on the 8,000 marijuana-growing operations in British Columbia. In Toronto, cocaine use among the adult population remains low but is increasing among youth, based on 1999 surveys. In 1999, 6.4 percent of students reported use of cocaine, compared with 2.7 percent in 1997. Injection of cocaine/crack has become a major problem in Toronto and rates of hepatitis C have been soaring. In the 1999 Toronto adult household survey, about 10 percent of the respondents said they had used marijuana during the past year. The school surveys show that marijuana use among students increased from 9 percent in 1993 to 19 percent in 1997 and to 26 percent in 1999. Requests for treatment of marijuana abuse rose dramatically in the late 1990s and have remained high. Seven percent of the Toronto students in 1999 reported using (lifetime) methamphetamine, and there were 30 methamphetamine seizures in the area. Increases in methamphetamine-related treatment requests also occurred in 1999. The Toronto school survey also shows an in-crease in ecstasy use-from 3 percent in 1995 to 9 percent in 1999. In 1999, there were 99 ecstasy admissions to the city's (St. Michael's) ER, another 10 just outside the city, and 27 in suburban areas. Steps are being taken to increase awareness of problems associated with ecstasy use and to prevent use of the drug. MalaysiaAbuse of amphetamine-type substances (ATS), especially methamphetamine, is increasing in Malaysia, as in other parts of the world. In a study of methamphetamine users in Penang, Malaysia, researchers from the Universiti Sains Malaysia and the National Narcotics Agency interviewed a sample of 70 ATS-positive arrestees using a questionnaire developed by NIDA. Most (92.9 percent) of the study subjects were male and Chinese (87.1 percent). Almost 29 percent were between the ages of 12 and 20 and nearly three-quarters were employed. Close to 60 percent had been using ATS during the 2 months prior to interview. Slightly more than three-quarters used ATS two to three times a day and most (85.7 percent) had a friend who used ATS. Reportedly ATS is popular in the "night scene." Arrestees reported that ATS made them feel happy, relaxed, and full of energy, and able to temporarily forget their problems. The ATS pill is typically mixed in a drink. ATS is reportedly easy to purchase. The average quality pill costs between RM30 to RM40 (U.S. $1 is RM 3.80). Subjects claim that quality is lower than when ATS was first introduced. MexicoData from a series of studies conducted in El Paso and Juarez, Mexico are being analyzed to produce information needed to develop more appropriate prevention and treatment interventions relevant to heroin abuse. The data were collected from April to November 2000 through surveys, surveillance information systems, ethnographic interviews, and focus groups. Interviews with heroin abusers were conducted in jails (n = 1,158), arrest facilities (n = 1,235), and treatment centers (n = 979). In ad-dition, interviews with heroin abusers were conducted in communities (n = 75) and with key informants (n = 54). Thirty-two in depth interviews were also completed. Preliminary findings show that relatively high proportions of jail inmates (25.1 percent), arrestees (30.7 percent) and treatment patients (34.4 percent) were daily abusers of heroin. More than 30 percent of the inmates, 49 percent of the arrestees, and 45 percent of the treatment patients had survived at least one heroin overdose. Multiple drug use was common. Substances used most often in combination with heroin were "pills" (e.g., Rohypnol), alcohol, and both pills and alcohol together. ThailandTrend data show dramatic increases in the abuse of amphetamine-type stimulants in Thailand. Manufacturing of ATS and retail markets have expanded extensively. Most illicit ATS tablets contain a combination of ephedrine, caffeine, and methamphetamine. In 1999, 64,232 clients were enrolled in drug abuse treatment programs in Thailand; 42.2 percent were new clients. Trend data on new treatment clients show that only 2.6 percent of the new clients in 1990 reported an ATS as their principal drug compared with 57.4 percent in 1999. The proportion of new ATS female clients increased from 1.9 percent in 1990 to 7.3 percent in 1999, and the mean age of these clients dropped from about 28 to 20. Most clients (96.9 percent) inhaled the drug. Law enforcement statistics show a similar trend. The percentages of drug-offense indictments related to ATS increased from 14.1 percent in 1995 to 73.9 percent in 1999. Indictments for ATS distribution were increasing dramatically among women age 40 and older. Data from a random sample of secondary school students in 1999 show that 6.5 percent had ever used an ATS and another 0.6 percent had only sold ATS. Among the ATS student users, 53 percent had used an ATS during the 6 months prior to the survey and 21.9 percent had used an ATS 20 or more days during the 30 days prior to survey. As ATS abuse indicators have been increasing in Thailand, heroin, opium, and other narcotics indicators have been decreasing. For example, among new treatment clients, those reporting heroin/opiates as their principal drug decreased from 90.8 percent in 1995 to 55.8 percent in 1999. Indictments for heroin/opium decreased from 30.8 percent of drug offenses in 1995 to 5.3 percent in 1999. United Nations Drug Control ProgrammeThrough its "Subregional Development of Institutional Capacity for Demand Reduction Among High Risk Groups" project, the UNDCP is helping six East Asian counties (Cambodia, China, Laos, Myanmar (Burma), Thailand, and Vietnam) better identify and assess risks for drug abuse in their populations, and develop model interventions. Activities in 1999-2000 in 30 cities included development and training on assessment methods and tools. Assessments are well underway and model interventions are being prepared. Observed drug abuse trends include the expanding use of amphetamine-type stimulants, increasing use of heroin in China, Myanmar, and Vietnam, declining opium use, and country-specific increases in drug related transmission of HIV. National Drug Intelligence CenterA report (National Drug Threat Assessment 2001) on current and emerging drug trends includes data collected from 950 law enforcement sources at the State and local levels. Concern about MDMA was raised by law enforcement officials in the following areas:
NIDA Grantee ResearchCost Effectiveness of Maintenance TherapiesA dynamic epidemic model developed by researchers at Palo Alto Veterans Affairs Health System and Stanford University, was used to determine the cost-effectiveness of methadone maintenance (MM), and buprenorphine treatment. Both studies considered the effects of the specific treatment on health care costs and survival, measured as quality adjusted life years (QALYs), and communities with HIV prevalence among injection drug users (IDUs) of 5 to 40 percent. The results showed that additional MM capacity would be cost-effective even if it were twice as expensive and half as effective as current MM slots. The model results for buprenorphine showed that this maintenance therapy for opiate addiction is cost-effective at $5 or less per dose, and would be cost-effective at $15 per dose if its adoption did not lead to a net decline in methadone use, or if a medium to high value were assigned to life lived by IDUs and those in maintenance therapy. Cost Effectiveness of HIV VaccinesResearchers from the Veterans Affairs Health Care System, Stanford University, and Sandia National Laboratories, Livermore, California, used mathematical and economic modeling to evaluate the benefits and costs of potential preventive and therapeutic HIV vaccines. Injection drug users would be one of the populations targeted. Vaccines were evaluated with a wide range of efficacy and duration of action. The research showed that vaccines of even limited efficacy (less than 50 percent) can provide enormous health benefits, and are likely to result in cost savings. Ethnographic Studies (San Francisco)Preliminary findings were presented from four NIDA-supported qualitative studies:
Back to Publications | Back to the CEWG Home Page
|
|||||||||||||||||||||||||||||||||||||||||||||||||||||||||||||||||||||||||||||||||||||||||||||||||||||||||||||||||||||||||||||||||||||||||||||||||||||||||||||||||||||||||||||||||||||||||||||||||||||||||||||||||||||||||||||||||||||||||||||||||||||||||||||||||||||||||||||||||||||||||||||||||||||||||||||||||||||||||||||||||||||||||||||||||||||||||||||||||||||||||||||||||||||||||||||||||||||||||||||||||||||||||||||||||||||||||||||||||||||||||||||||||||||||||||||||||||||||||||||||||||||||||||||||||||||||||||||||||||||||||||