Life Expectancy
Life expectancy is a summary measure of the overall health of a population. It represents the average number of years of life remaining to a person at a given age if death rates were to remain constant. In the United States, improvements in health have resulted in increased life expectancy and contributed to the growth of the older population over the past century.
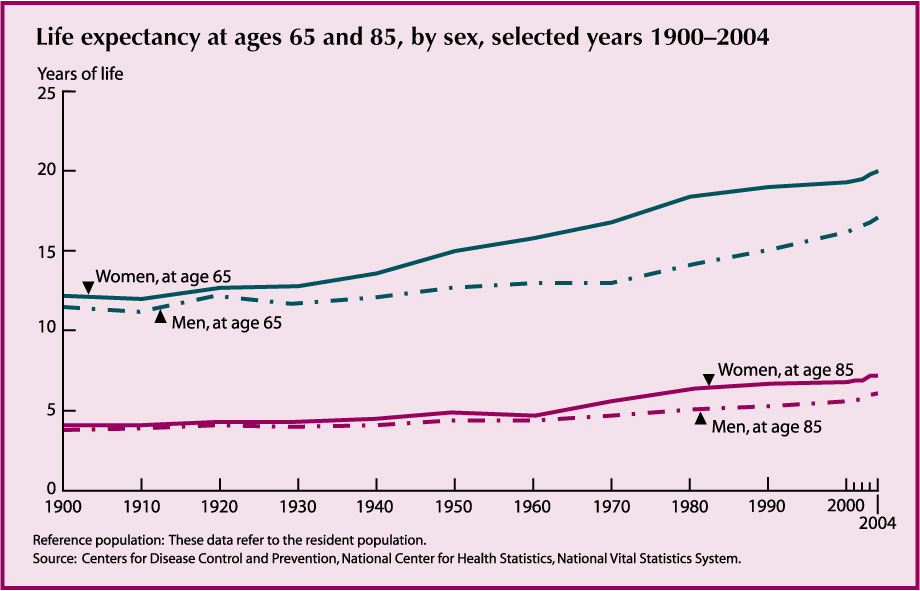
- Americans are living longer than ever before. Life expectancies at both age 65 and age 85 have increased. Under current mortality conditions, people who survive to age 65 can expect to live an average of 18.7 more years, almost 7 years longer than people age 65 in 1900. The life expectancy of people who survive to age 85 today is 7.2 years for women and 6.1 years for men.
- Life expectancy varies by race, but the difference decreases with age. In 2004, life expectancy at birth was 5.2 years higher for white people than for black people. At age 65, white people can expect to live an average of 1.6 years longer than black people. Among those who survive to age 85, however, the life expectancy among black people is slightly higher (7.1 years) than white people (6.7 years).
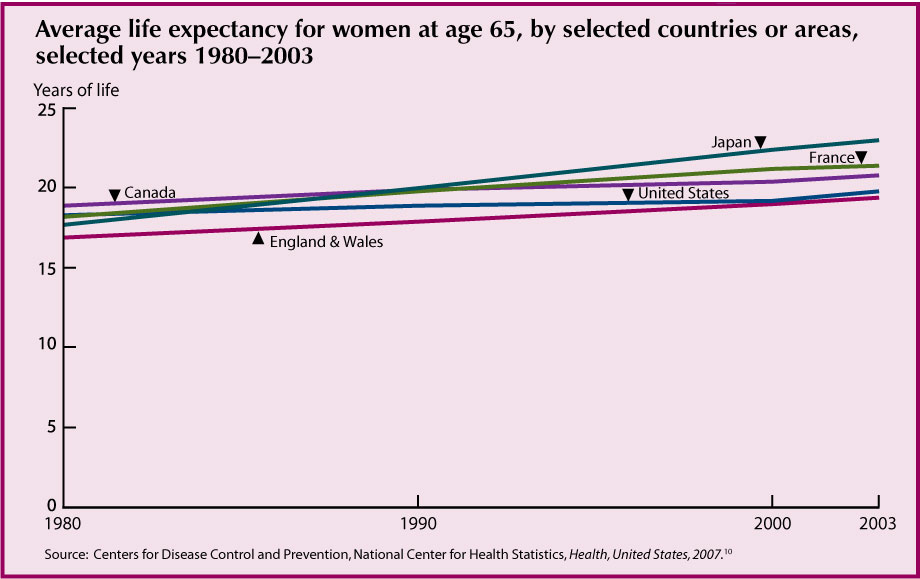
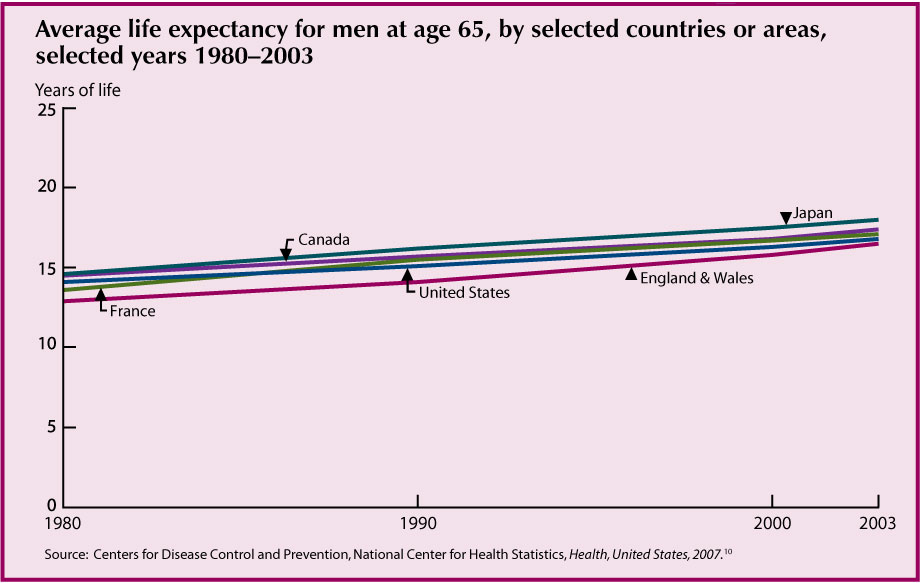
- Life expectancy at age 65 in the United States is lower than that of many other industrialized nations. In 2003, women age 65 in Japan could expect to live on average 3.2 years longer than women in the United States. Among men, the difference was 1.2 years.
Data for this indicator’s charts and bullets can be found in Tables 14a, 14b, and 14c.
Mortality
Overall, death rates in the U.S. population have declined during the past century. But for some diseases, death rates among older Americans have increased in recent years.
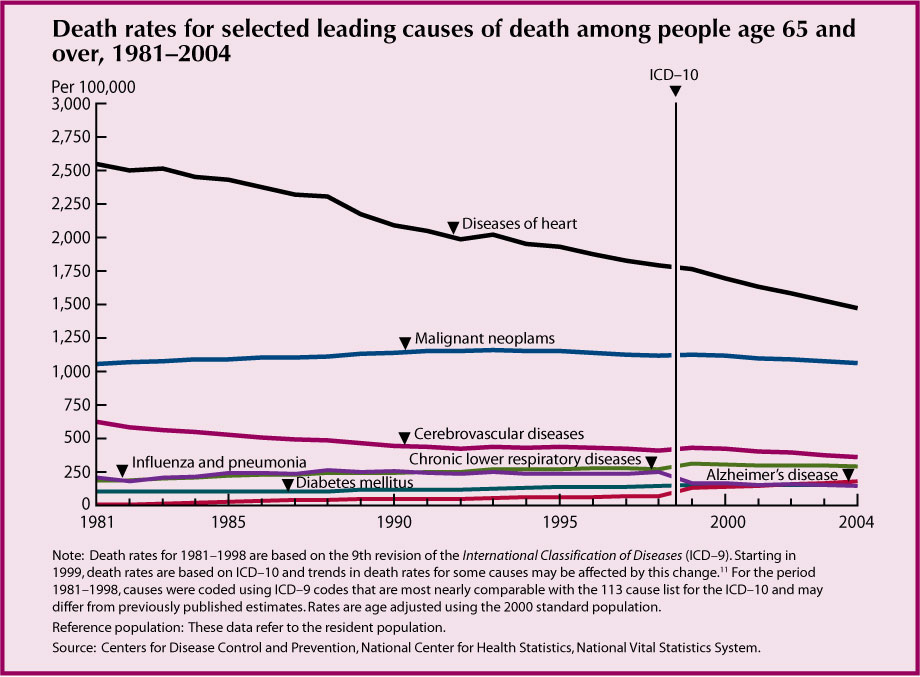
· In 2004, the leading cause of death among people age 65 and over was diseases of heart (heart disease) (1,418 deaths per 100,000 people), followed by malignant neoplasms (cancer) (1,052 per 100,000), cerebrovascular diseases (stroke) (346 per 100,000), chronic lower respiratory diseases (284 per 100,000), Alzheimer’s disease (171 per 100,000), diabetes mellitus (146 per 100,000), and influenza and pneumonia (139 per 100,000).
· Between 1981 and 2004, age adjusted death rates for all causes of death among people age 65 and over declined by 18 percent. Death rates for heart disease and stroke declined by approximately 44 percent. Age adjusted death rates for diabetes increased by 38 percent since 1981, and death rates for chronic lower respiratory diseases increased by 53 percent.
· Heart disease and cancer are the top two leading causes of death among all people age 65 and over, irrespective of sex, race, or Hispanic origin.
· Other causes of death vary among older people by sex and race and Hispanic origin. For example, men have much higher suicide rates than those of women at all ages, with the largest difference occurring at age 85 and over (45 deaths per 100,000 population for men compared with 4 per 100,000 for women). Non-Hispanic white men age 85 and over have the highest rate of suicide overall at 50 deaths per 100,000.12
Data for this indicator’s chart and bullets can be found in Tables 15a, 15b, and 15c.
Chronic Health Conditions
Chronic diseases are long-term illnesses that are rarely cured. Chronic diseases such as heart disease, stroke, cancer, and diabetes are among the most common and costly health conditions.13 Chronic health conditions negatively affect quality of life, contributing to declines in functioning and the inability to remain in the community.14 Many chronic conditions can be prevented or modified with behavioral interventions. Six of the seven leading causes of death among older Americans are chronic diseases. (See “Indicator 15: Mortality.”)
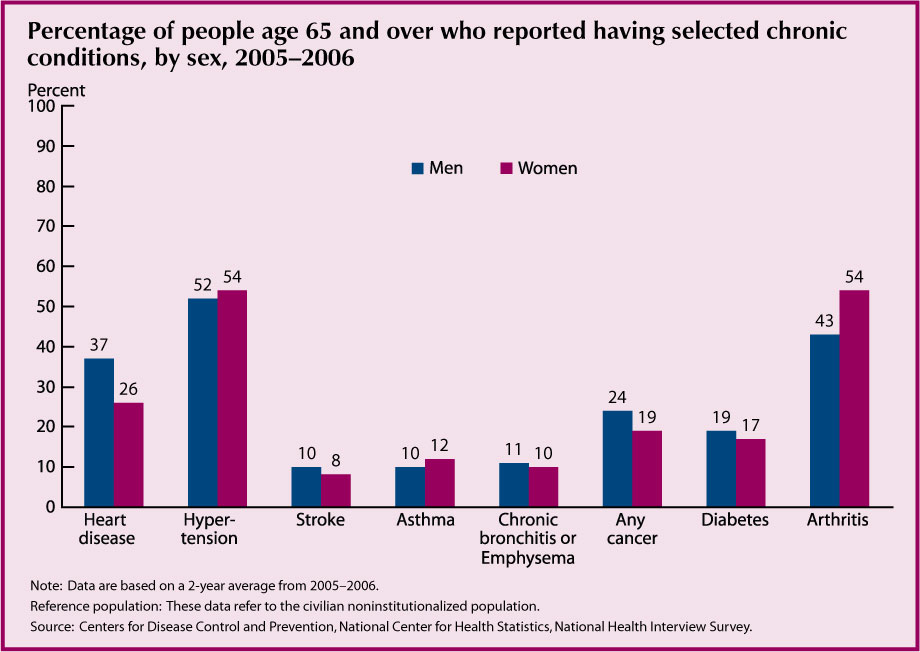
- The prevalence of certain chronic conditions differs by sex. Women report higher levels of arthritis than men. Men report higher levels of heart disease and cancer.
- There are differences by race and ethnicity in the prevalence of certain chronic conditions. In 2005–2006, among people age 65 and over, non-Hispanic blacks report higher levels of hypertension and diabetes than non-Hispanic whites (70 percent compared with 51 percent for hypertension and 29 percent compared with 16 percent for diabetes). Hispanics also report higher levels of diabetes than non-Hispanic whites (25 percent compared with 16 percent), but similar levels of hypertension (54 percent and 51 percent, respectively) and lower levels of arthritis (40 percent compared with 50 percent).
Data for this indicator’s chart and bullets can be found in Tables 16a and 16b.
Sensory Impairments and Oral Health
Vision and hearing impairments and oral health problems are often thought of as natural signs of aging. Often, however, early detection and treatment can prevent, or at least postpone, some of the debilitating physical, social, and emotional effects these impairments can have on the lives of older people. Glasses, hearing aids, and regular dental care are not covered services under Medicare.
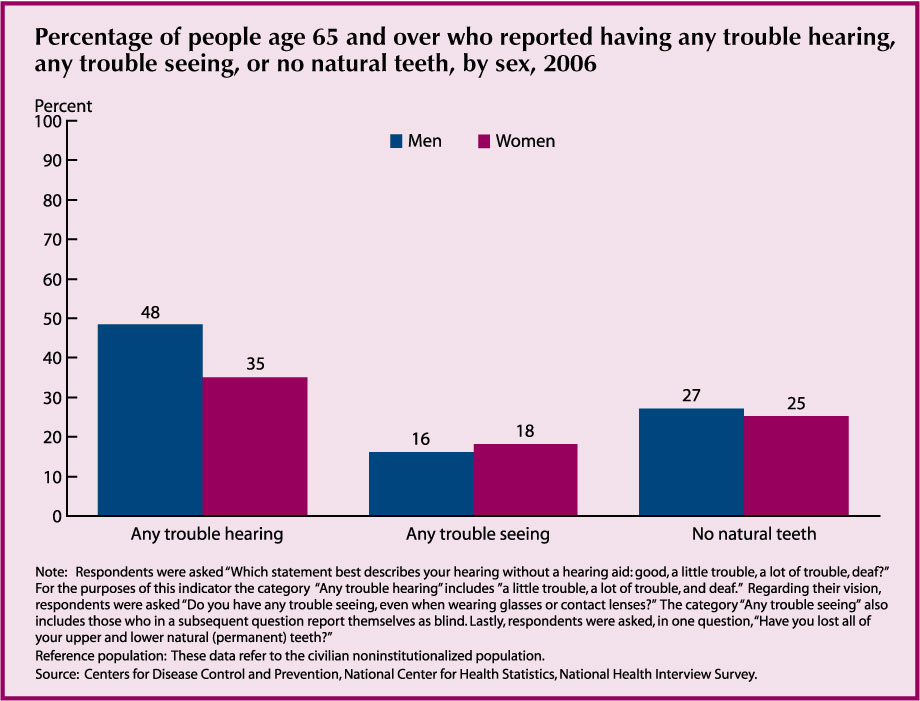
· In 2006, close to one-half of older men and more than one-third of older women reported trouble hearing. The percentage with trouble hearing was higher for people age 85 and over (62 percent) than for people age 65–74 (32 percent). Ten percent of all older women and 18 percent of all older men reported having ever worn a hearing aid.
· Vision trouble affects 17 percent of the older population, 16 percent of men and 18 percent of women. Among people age 85 and over, 27 percent reported trouble seeing.
· The prevalence of edentulism, having no natural teeth, was higher for people age 85 and over (32 percent) than for people age 65–74 (23 percent). Socioeconomic differences are large. Thirty-nine percent of older people with family income below the poverty line reported no natural teeth compared with 26 percent of people above the poverty threshold.
Data for this indicator’s charts and bullets can be found in Tables 17a and 17b.
Respondent-Assessed Health Status
Asking people to rate their health as excellent, very good, good, fair, or poor provides a common indicator of health easily measured in surveys. It represents physical, emotional, and social aspects of health and well-being. Respondent-assessed health ratings of poor correlate with higher risks of mortality.15
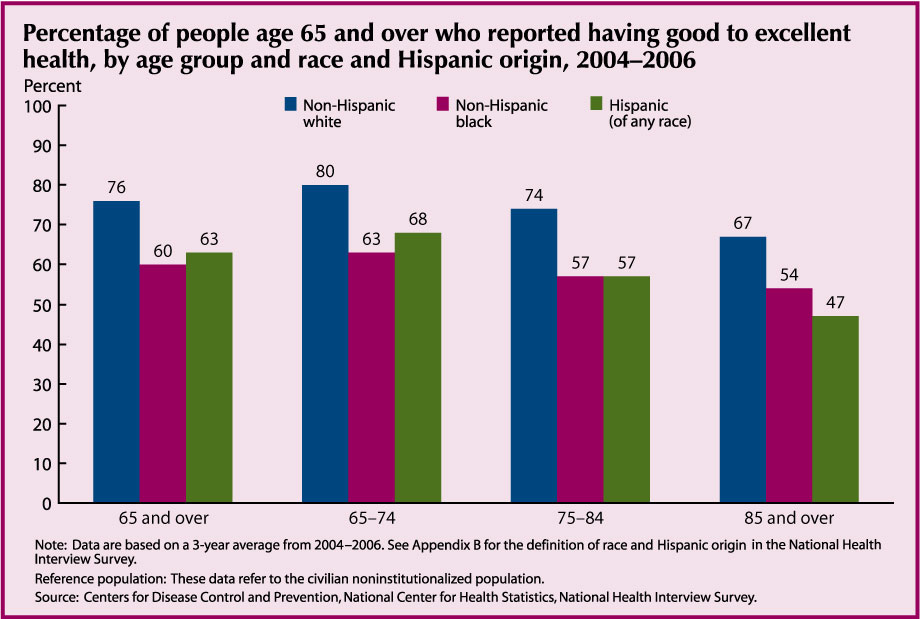
- During the period 2004–2006, 74 percent of people age 65 and over rated their health as good or better. This has been true for the decades preceding 2004 as well; the majority of older people reported their health to be good to excellent.
- The proportion of people reporting good to excellent health decreases among the older age groups. Among men, 78 percent of those age 65–74 report good or better health. At age 85 and over, 63 percent of men report good or better ratings. This pattern is evident among women and within race and ethnic groups.
- Regardless of age, older non-Hispanic white men and women are more likely to report good health than their non-Hispanic black and Hispanic counterparts. Non-Hispanic blacks and Hispanics are similar to one another in their positive health evaluations, although among men age 85 and over, Hispanics have the lowest health ratings
Data for this indicator’s chart and bullets can be found in Table 18.
Depressive Symptoms
Depressive symptoms are an important indicator of general well-being and mental health among older adults. People who report many depressive symptoms often experience higher rates of physical illness, greater functional disability, and higher health care resource utilization.16,17
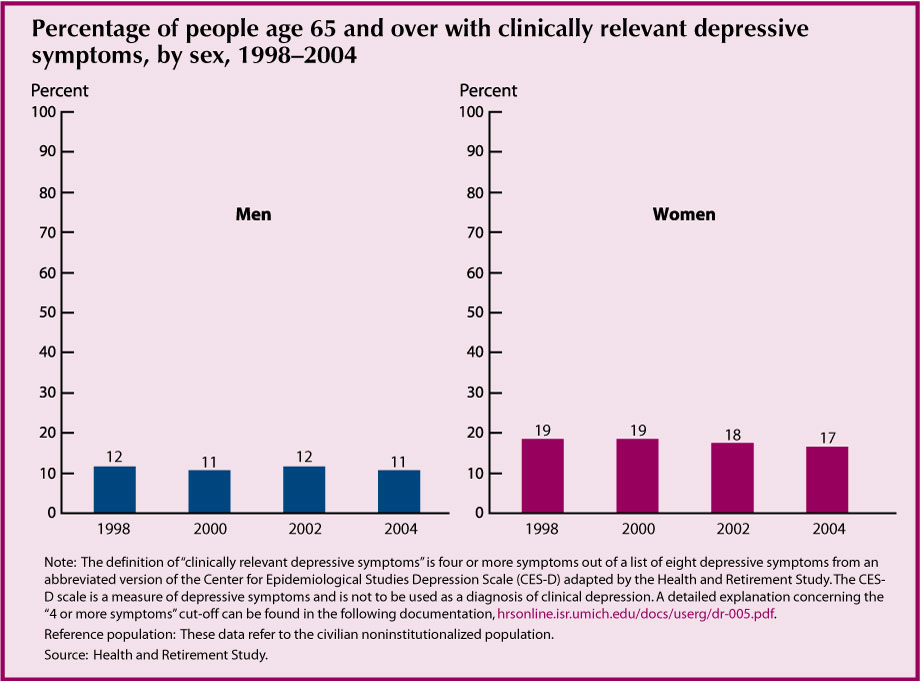
- Older women are more likely to report clinically-relevant depressive symptoms than older men. In 2004, 17 percent of women age 65 and over reported depressive symptoms compared with 11 percent of men. There has been no significant change in this sex difference between 1998 and 2004.
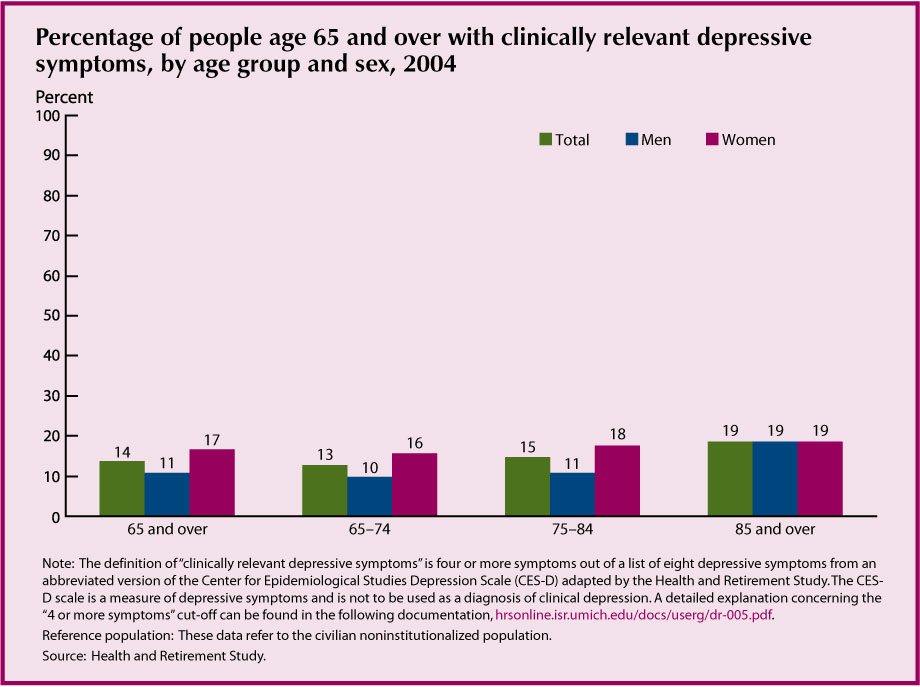
- The percentage of people reporting clinically-relevant depressive symptoms has remained relatively stable over the past few years. Between 1998 and 2004, the percentage of men who reported depressive symptoms ranged between 11 percent and 12 percent. The percentage of women reporting depressive symptoms ranged between 17 and 19 percent.
- The prevalence of clinically-relevant depressive symptoms is related to age. In 2004, the proportion of people age 65 and over with clinically-relevant depressive symptoms was higher for people age 85 and over (19 percent) than for people age 65–74 (13 percent).
- In 2004, the percentage of women age 85 and over reporting depressive symptoms (19 percent) was almost 20 percent higher than the percentage of women age 65–74 (16 percent) reporting the same depressive symptoms. The percentage of men age 85 and over reporting clinically-relevant depressive symptoms (19 percent) is almost double the percentage of men age 65–74 (10 percent) reporting symptoms.
- Serious psychological distress is another measure of mental health. It identifies people who have a diagnosable mental disorder (such as schizophrenia, bipolar disorder, or severe forms of depression) resulting in functional impairment in major life activities.18 In 2006, 2 percent of people age 65 and over reported experiencing symptoms of serious psychological distress.19
- Antidepressants can be an effective treatment for the specific illness of major depressive disorder.20 The use of antidepressants among noninstitutionalized people age 65 and over increased from 9 percent in 1997 to 13 percent in 2002.21
Data for this indicator’s charts and bullets can be found in Tables 19a and 19b.
Functional Limitations
Functioning in later years may be diminished if illness, chronic disease, or injury limits physical and/or mental abilities. Changes in functional limitation rates have important implications for work and retirement policies, health and long-term care needs, and the social well-being of the older population.
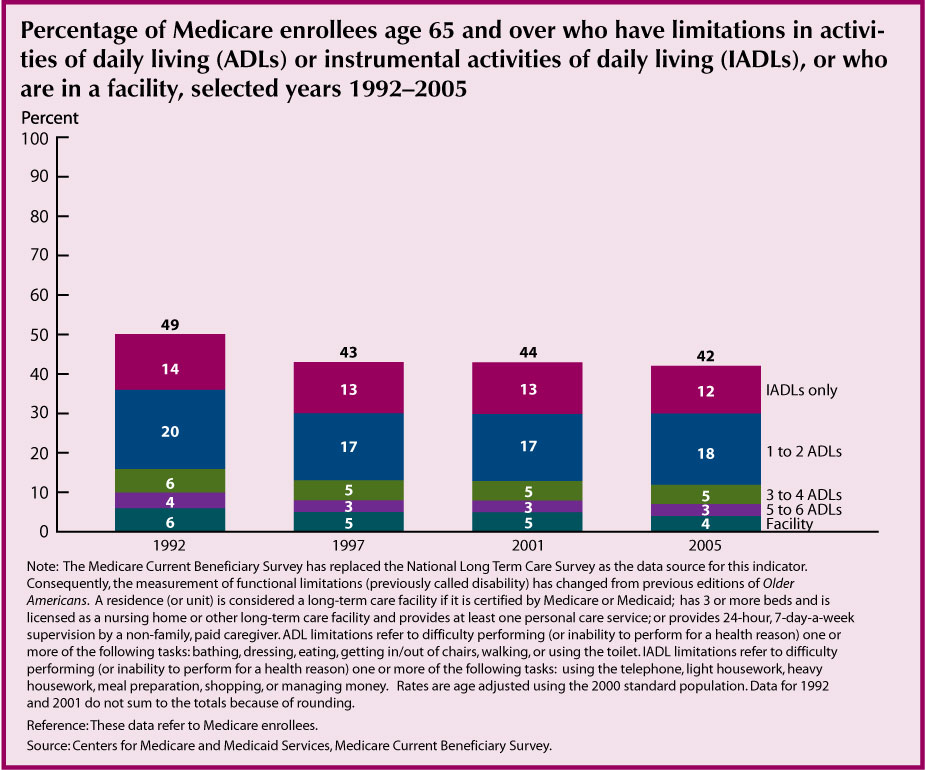
- In 2005, more than two-fifths (42 percent) of people age 65 and over reported a functional limitation. Twelve percent had difficulty per-forming one or more IADLs (but no ADL limitation). Eighteen percent had difficulty with 1–2 ADLs, 5 percent had difficulty with 3–4 ADLs, 3 percent had difficulty with 5–6 ADLs, and 4 percent were in a facility.
- The age adjusted proportion of people age 65 and over with a functional limitation declined from 49 percent in 1992 to 42 percent in 2005. There was a steady decrease in the percent with limitations from 1992 until 1997. From 1997 to 2005 the overall levels have not significantly changed, although the decline in facility residence has continued.
- Women have higher levels of functional limitations than men. In 2005, 47 percent of female Medicare enrollees age 65 and over had difficulty with ADLs or IADLs, or were in an institution, compared with 35 percent of male Medicare enrollees. Rates of decline since 1992 are similar for men and women.
Different indicators can be used to monitor functioning, including limitations in Activities of Daily Living (ADLs) and Instrumental Activities of Daily Living (IADLs), and measures of physical, cognitive, and social functioning. Aspects of physical functioning such as the ability to lift heavy objects, walk 2–3 blocks, or reach up over one’s head are more closely linked to physiological capabilities than are ADLs and IADLs, which also may be influenced by social and cultural role expectations and by changes in technology.
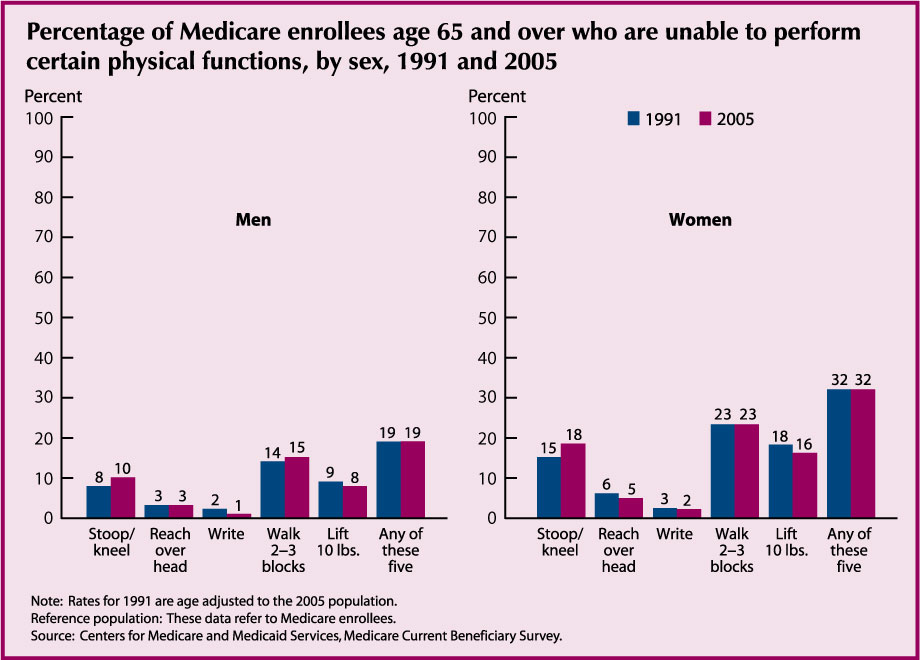
- Older women reported more problems with physical functioning than older men. In 2005, 32 percent of women reported they were unable to perform at least one of five activities, compared with 19 percent of men.
- Problems with physical functioning were more frequent at older ages. Among men aged 65–74, 14 percent reported they were unable to perform at least one of five activities, compared with 38 percent of men aged 85 and over. Among women, 22 percent of those aged 65–74 were unable to perform at least one activity, compared with 56 percent of those aged 85 and over.
- Physical functioning was not strongly related to race in 2005. Among men, 19 percent of non-Hispanic whites were unable to perform at least one activity, compared with 24 percent of non-Hispanic blacks. Among women, there were no significant differences among non-Hispanic whites, non-Hispanic blacks, and Hispanics, regarding ability to perform at least one activity.
Data for this indicator’s charts and bullets can be found in Tables 20a, 20b, and 20c.