Vaccinations
Vaccinations against influenza and pneumococcal disease are recommended for older Americans, who are at increased risk for complications from these diseases compared with younger individuals.22,23 Influenza vaccinations are given annually, and pneumococcal vaccinations are usually given once in a lifetime. The costs associated with these vaccinations are covered under Medicare Part B.
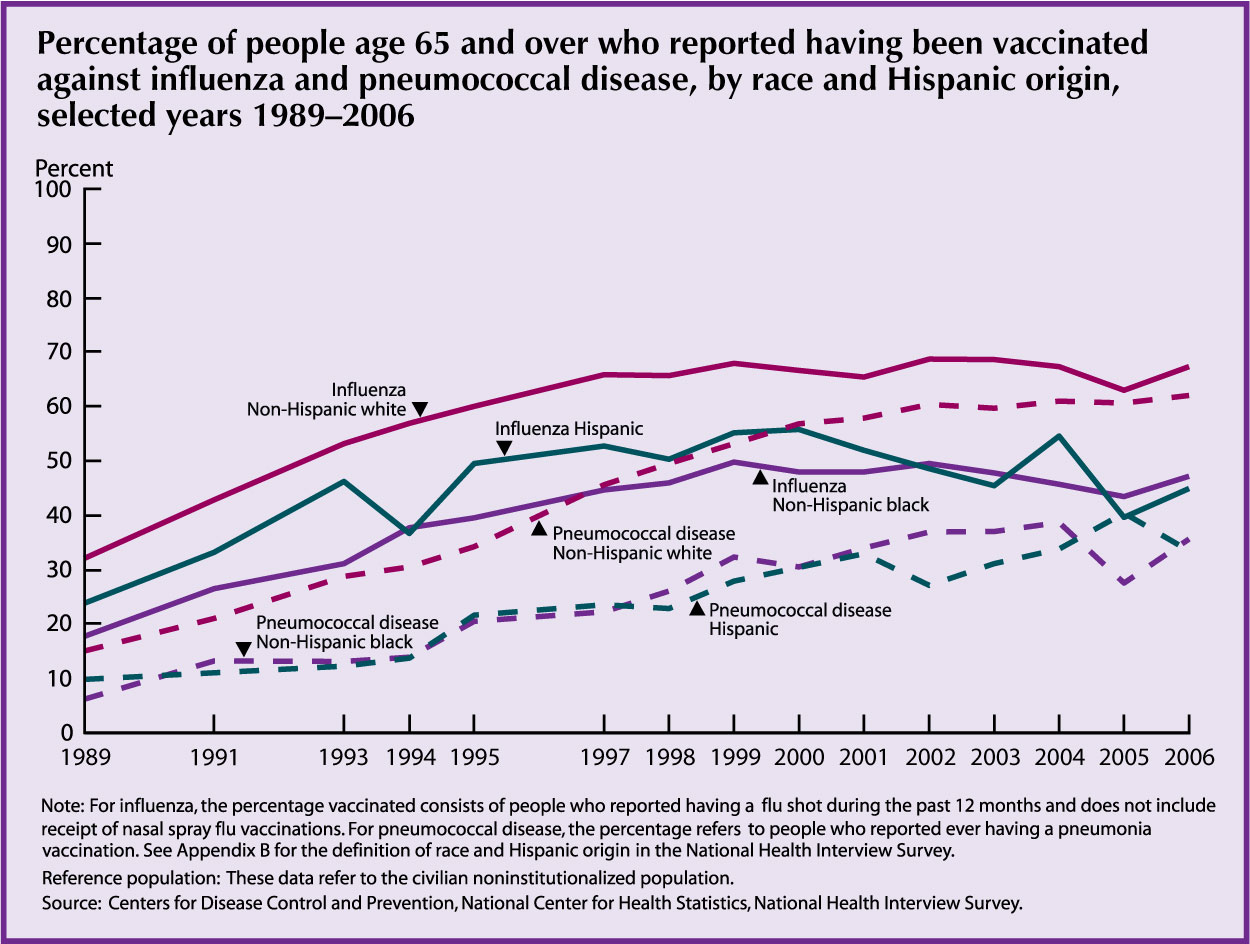
- In 2006, 64 percent of people age 65 and over reported receiving a flu shot in the past 12 months; however, there are differences by race and ethnicity. Sixty-seven percent of non-Hispanic whites reported receiving a flu shot compared with 47 percent of non-Hispanic blacks and 45 percent of Hispanics.
- In 2006, 57 percent of people age 65 and over had ever received a pneumonia vaccination. Despite recent increases in the rates for all groups, non-Hispanic whites were more likely to have received a pneumonia vaccination (62 percent) compared with non-Hispanic blacks (36 percent) or Hispanics (33 percent).
Data for this indicator’s chart and bullets can be found in Tables 21a and 21b.
Mammography
Health care services and screenings can help prevent disease or detect it at an early, treatable stage. Mammography has been shown to be effective in reducing breast cancer mortality among women age 40 and over, especially for the 50–69 age group.24
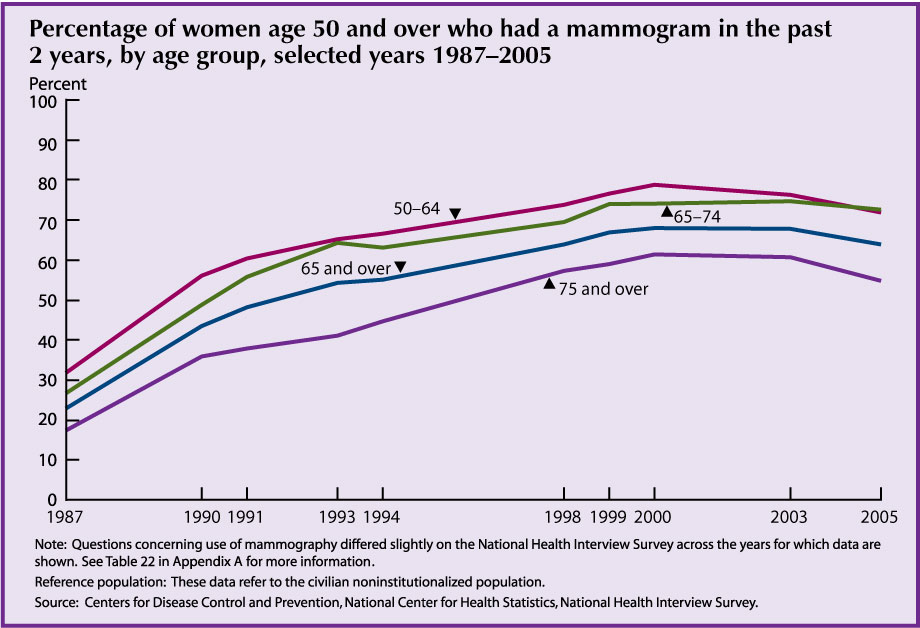
- Among women age 65 and over, the percentage who had a mammogram within the preceding 2 years almost tripled from 23 percent in 1987 to 64 percent in 2005. While there was a significant difference in 1987 between the percentage of older non-Hispanic white women (24 percent) and the percentage of older non-Hispanic black women (14 percent) who reported having had a mammogram, in recent years, this difference has disappeared.
- Older women who were poor were less likely to have had a mammogram in the preceding 2 years than older women who were not poor. In 2005, 52 percent of women age 65 and over who lived in families with incomes less than 100 percent of the poverty threshold reported having had a mammogram. Among older women living in families with incomes 200 percent or more of the poverty threshold, 70 percent reported having had a mammogram.
- Older women without a high school diploma were less likely to have had a mammogram than older women with a high school diploma. In 2005, 51 percent of women age 65 and over without a high school diploma reported having had a mammogram in the preceding 2 years, compared with 64 percent of women who had a high school diploma and 73 percent of women who had some college education.
Data for this indicator’s chart and bullets can be found in Table 22.
Dietary Quality
A healthful diet can reduce some major risk factors for chronic diseases, such as obesity, Type 2 diabetes, high blood pressure, and high blood cholesterol.25 The Healthy Eating Index-2005 (HEI-2005) is a tool designed to measure compliance of diets with the key diet-quality recommendations of the 2005 Dietary Guidelines for Americans.26
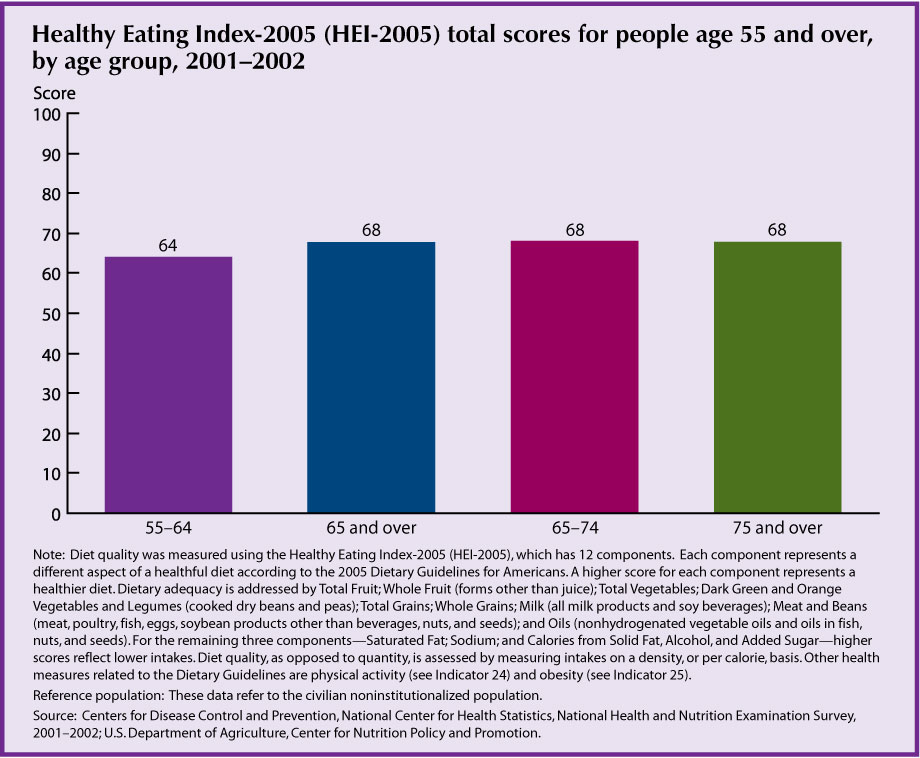
In 2001–2002, the total HEI-2005 score for adults age 65 and over was 68 out of the maximum 100 points. There were no significant differences among the HEI-2005 total scores for adults age 55–64, 65–74, or 75 and over.
HEI-2005 component scores for people age 65 and over indicate a need to increase intakes of a number of food groups. Most in need of improvement are intakes of whole grains; dark green and orange vegetables and legumes; and fat-free and lowfat milk and milk products. Other food groups needing increased intake are all types of vegetables and fruit. Oils, including those in fish, nuts, and seeds, should replace some solid fats. Decreased intakes are needed especially of sodium, saturated fat, and calories from foods and beverages with solid fats, added sugar, and alcohol.
Data for this indicator’s chart and bullets can be found in Table 23.
Physical Activity
Physical activity is beneficial for the health of people of all ages, including the 65 and over population. It can reduce the risk of certain chronic diseases, may relieve symptoms of depression, helps to maintain independent living, and enhances overall quality of life.27,28 Research has shown that even among frail and very old adults, mobility and functioning can be improved through physical activity.29
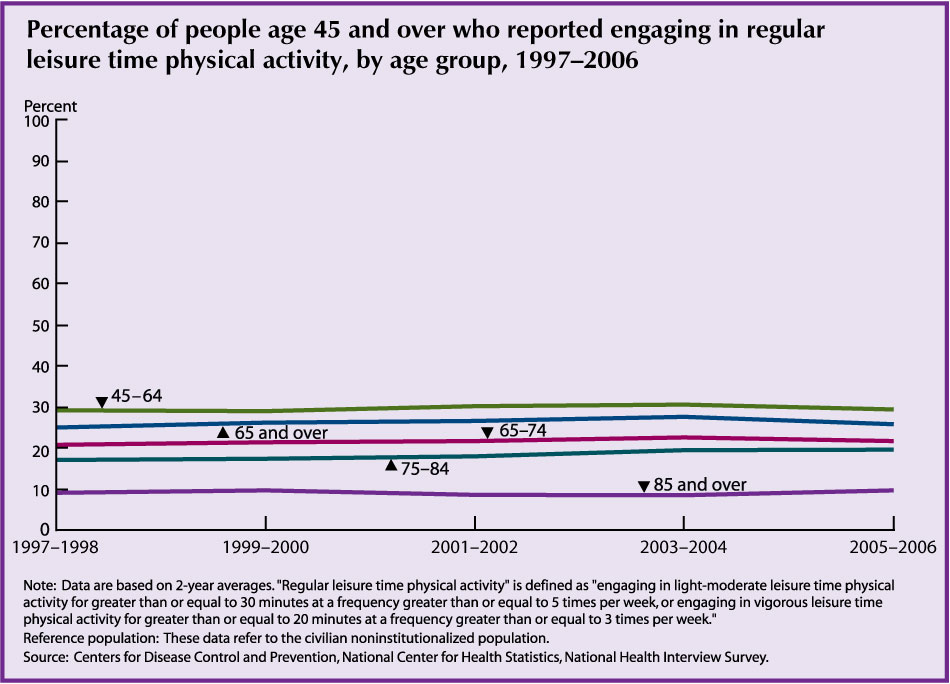
- In 2005–2006, 22 percent of people age 65 and over reported engaging in regular leisure time physical activity. The percentage of older people engaging in regular physical activity was lower at older ages, ranging from 26 percent among people age 65–74 to 10 percent among people age 85 and over. There was no significant change in the percentage reporting physical activity between 1997 and 2006.
- Men age 65 and over are more likely than women in the same age group to report engag-ing in regular leisure time physical activity (25 percent and 19 percent, respectively, in 2005–2006). Older non-Hispanic white people report higher levels of physical activity than non-Hispanic black people or Hispanics (23 percent compared with 16 percent for Hispanics and 14 percent for non-Hispanic blacks in 2005–2006).
- Other forms of physical activity also contribute to overall health and fitness. Strength training is recommended as part of a comprehensive physical activity program among older adults and may help to improve balance and decrease risk of falls.30 Thirteen percent of older people reported engaging in strengthening exercises in 2005–2006.
Data for this indicator’s chart and bullets can be found in Tables 24a and 24b.
Obesity
Obesity and overweight have reached epidemic proportions in the United States. Similar to cigarette smoking, obesity is a major cause of preventable disease and premature death.31 Both are associated with increased risk of coronary heart disease; Type 2 diabetes; endometrial, colon, postmenopausal breast, and other cancers; asthma and other respiratory problems; osteoarthritis; and disability.32,33
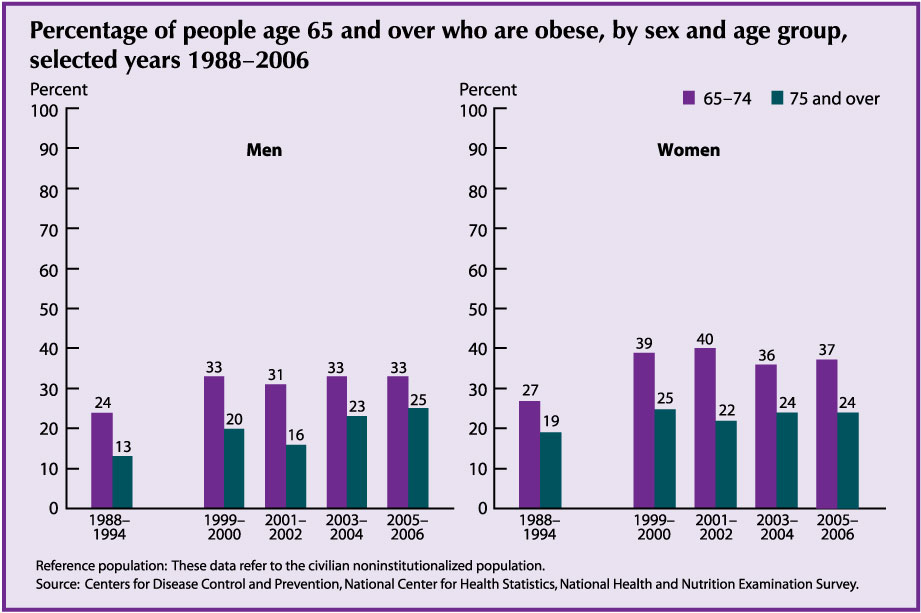
- As with other age groups, the percentage of people age 65 and over who are obese has increased since 1988–1994. In 2005–2006, 37 percent of noninstitutionalized women age 65–74 and 24 percent of women age 75 and over were obese. This is an increase from 1988–1994, when 27 percent of women age 65–74 and 19 percent of women age 75 and over were obese.
- Older men follow similar trends; 24 percent of men age 65–74 and 13 percent of men age 75 and over were obese in 1988–1994, compared with 33 percent of men age 65–74 and 25 percent of men age 75 and over in 2005–2006.
- Over the past 7 years, the trend has leveled off, with no statistically significant change in obesity for older men or women between 1999–2000 and 2005–2006.
Data for this indicator’s chart and bullets can be found in Table 25.
Cigarette Smoking
Smoking has been linked to an increased likelihood of cancer, cardiovascular disease, chronic obstructive lung diseases, and other debilitating health conditions. Among older people, the death rate for chronic lower respiratory diseases (the fourth leading cause of death among people age 65 and over) increased 53 percent between 1981 and 2004. See “Indicator 15: Mortality.” This increase reflects, in part, the effects of cigarette smoking.34
- The percentage of older Americans who are current cigarette smokers declined dramatically in the four decades between 1965 and 2005. Most of the decrease during this period is the result of the declining prevalence of cigarette smoking among men (from 29 percent in 1965 to 9 percent in 2005). For the same period, the percentage of women who smoke cigarettes has remained relatively constant, increasing slightly from 10 percent in 1965 before declining to 8 percent in 2005.
- In 2006, however, the decline among older male smokers appeared to have reversed, with the percentage of current male smokers increasing to 13 percent. This observed increase for men in 2006 may be an anomaly as preliminary data for January–June 2007 show a return to the level in 2005 (9 percent). Among women of the same age, levels of cigarette smoking remained the same (8 percent in both 2006 and 2007).
- A large percentage of men and women age 65 and over are former smokers. In 2006, 51 percent of older men previously smoked cigarettes, while nearly 28 percent of women age 65 and over were former smokers.
Data for this indicator’s chart and bullets can be found in Tables 26a and 26b.
Air Quality
As people age, their bodies are less able to compensate for the effects of environmental hazards. Air pollution can aggravate heart and lung disease, leading to increased medication use, more visits to health care providers, admissions to emergency rooms and hospitals, and even death.35–39 An important indicator for environmental health is the percentage of older adults living in areas that have measured air pollutant concentrations above the Environmental Protection Agency’s (EPA) established standards. Ozone and particulate matter (PM) (especially smaller, fine particle pollution called
PM 2.5) have the greatest potential to affect the health of older adults.
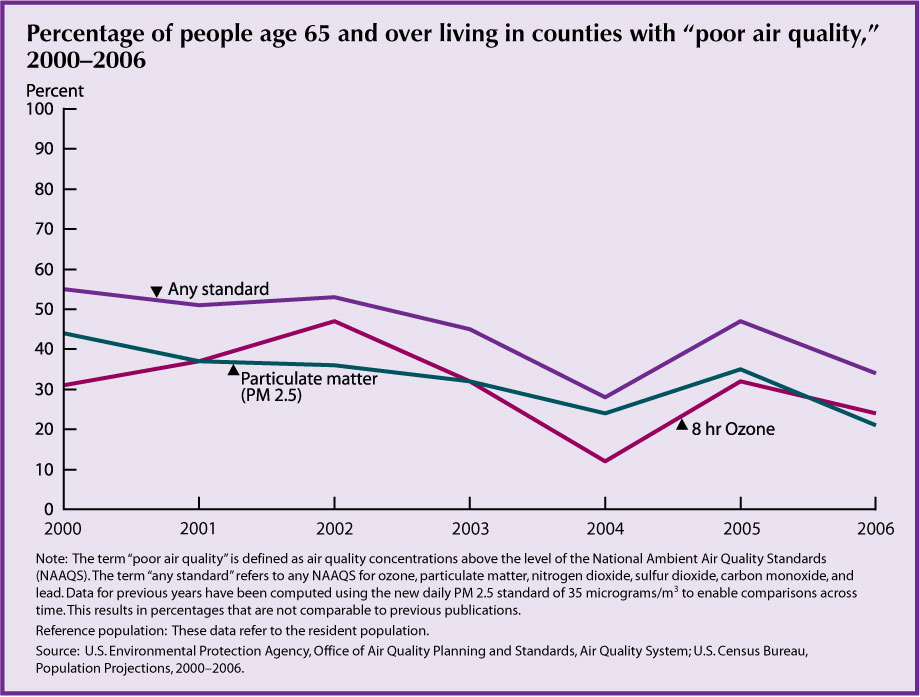
- In 2006, 24 percent of people age 65 and over lived in counties with poor air quality for ozone compared with 31 percent in 2000. Since the year 2000, ground level ozone pollution peaked in 2002 when the United States experienced a hot, dry summer climate that was particularly conducive to the formation of ground-level ozone.
- A comparison of 2000 and 2006 shows a reduction in PM 2.5. In 2000, 44 percent of people age 65 and over lived in a county where PM 2.5 concentrations were at times above the EPA standards compared with 21 percent of people age 65 and over in 2006.
- The percentage of people age 65 and over living in counties that experienced poor air quality for any air pollutant decreased from 55 percent in 2000 to 34 percent in 2006.
Air quality varies across the United States; thus, where people live can affect their health risk. Each State monitors air quality and reports findings to the Environmental Protection Agency (EPA). In turn, the EPA determines whether pollutant measurements meet the standards that have been set to protect human health.
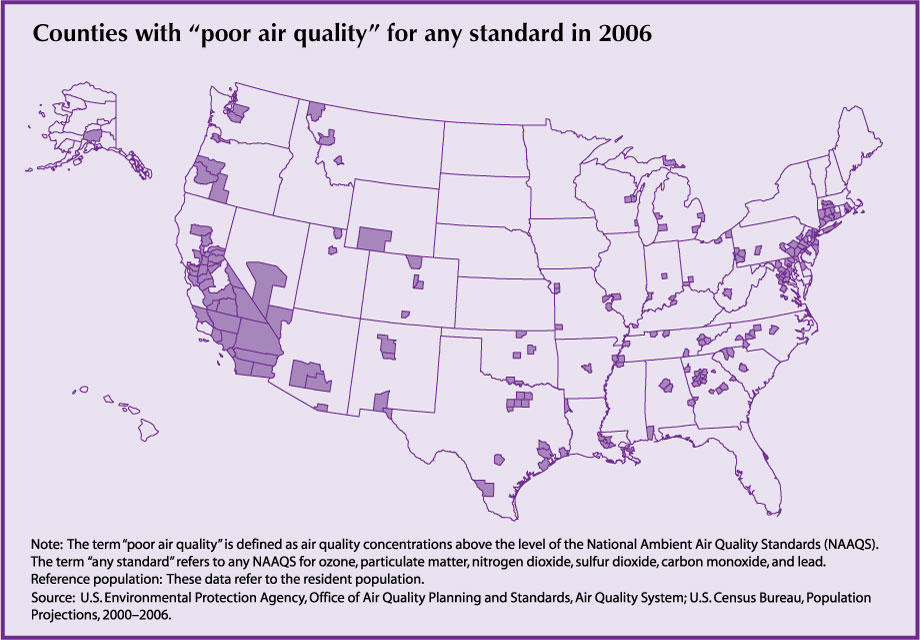
- In 2006, nearly 38 percent of the population lived in a county where measured air pollutants reached concentrations above EPA standards. This percentage was fairly consistent across all age groups, including people age 65 and over.
- Overall, approximately 113 million people lived in counties where monitored air in 2006 was unhealthy at times because of high levels of at least one of the six principal air pollutants: ozone, particulate matter (PM), nitrogen dioxide, sulfur dioxide, carbon monoxide, and lead. The vast majority of areas that experienced unhealthy air did so because of one or both of two pollutants—ozone and PM.
Data for this indicator’s charts and bullets can be found in Tables 27a and 27.
Use of Time
How individuals spend their time reflects their financial and personal situations, needs, or desires. Time-use data show that as Americans get older, they spend more of their time in leisure activities.
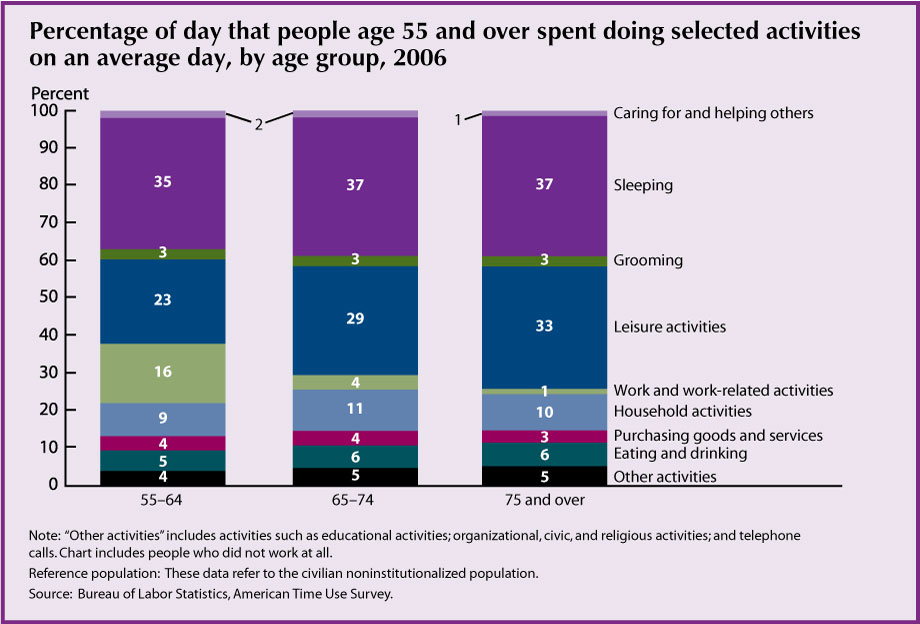
- In 2006, older Americans spent on average more than one-quarter of their time in leisure (6.5 hours per day). This proportion increased with age: Americans age 75 and over spent 33 percent of their time in leisure compared with 23 percent for those age 55–64.
- On an average day, people age 55–64 spent 16 percent of their time (almost 4 hours) working or doing work-related activities compared with 4 percent (less than one hour) for people age 65–74 and 1 percent (less than 30 minutes) for people age 75 and over.
- Leisure activities are those done when free from duties such as working, household chores, or caring for others. During these times, individuals have flexibility in choosing what to do.
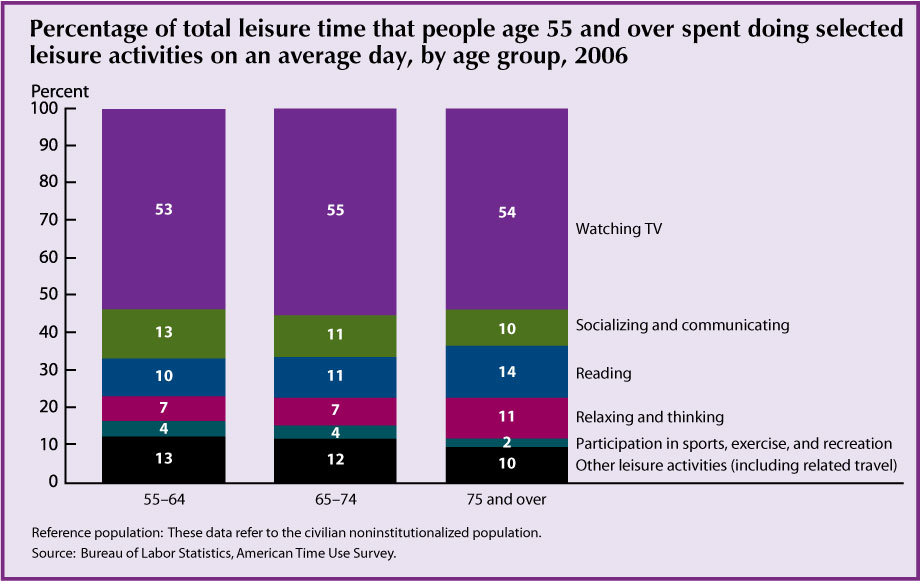
- Watching TV was the activity that occupied the most leisure time—about one-half the total—for Americans age 55 and over.
- Americans age 75 and over spent a higher percentage of their leisure time reading (14 percent versus 10 percent) and relaxing and thinking (11 percent versus 7 percent) than did Americans age 55–64.
- The proportion of leisure time that older Americans spent socializing and communicating—such as visiting friends or attending or hosting social events—declined with age. For Americans age 55–64, 13 percent of leisure time was spent socializing and communicating compared to 10 percent for those age 75 and over.
Data for this indicator’s charts and bullets can be found in Tables 28a and 28b.