This chapter will cover:
- Ways to prioritize oral health issues
- Choosing target populations
- Criteria for developing objectives
- Examples of how states and communities developed objectives
- Examples of state oral health objectives
- Creating a needs assessment plan and obtaining baseline data
- Tips for setting target levels for objectives
- Considerations for evaluating data collection methods and data
- Resources for data and assistance
When people are motivated to do something to address health problems and disparities, they immediately want to engage in some form of action and see some results. This phase of planning may not be satisfying for all of your partners. Many well-intended partners do not want to sit and discuss objectives, look for baseline measures or create evaluation plans. The challenge that always confronts public health professionals when trying to promote HP 2010 is gaining commitment to use an organized planning approach based on setting priorities, developing measurable objectives, setting realistic targets, and measuring progress at regular intervals. Without this approach, interventions become fragmented, people lose sight of the desired outcome, the "doers" get tired, and progress is impossible to track. The challenge at this stage is to engage the "passionate doers" primarily when they can "do" something such as "vote" on options, "survey" people in their neighborhood about oral health knowledge and attitudes, or "examine" children to collect baseline data and refer them for the care they need.
Tips
- Make the best use of your partners’ time and interests.
- Learn what community members and key partners see as important oral health issues and why they feel they are important.
- Be clear about the criteria for determining priorities and establishing objectives; gain ownership for the process.
- Align priorities, objectives, and strategies with your state’s or community’s strengths, assets, barriers, and opportunities.
- Before collecting new data, determine what data already exist and if they are adequate to serve as baseline data.
- Use the many on-line data sources that are available.
- Set challenging yet realistic targets for objectives. Decide what intervals to use to track progress on objectives. Intervals may not be the same for all objectives.
Using the National Objectives as a Framework
Healthy People 2010 provides a framework to assess health status, health behaviors and services, and to plan and evaluate health promotion programs. The national objectives serve as a "menu" for identifying priorities and selecting objectives that are most relevant to states, territories, tribes, communities, settings (schools, worksites, etc.), and health care delivery systems. By using the national objectives as a common point of departure, agencies and organizations can tailor programs for their customers, yet retain a common basis for evaluating performance in relation to the nation, other states, or other populations.
 A new focus on "performance" and "accountability" is prompting health agencies to shift their emphasis on primarily providing services to include needs assessment and methods to assure that quality care is provided. This shift requires increased collection and analysis of data. Health care providers are being asked to collect information on patients, services, and outcomes in a standardized way. This emphasis on assessment and evaluation increases the need to address issues of data availability, validity/reliability, comparability, and utilization. Although the large number and diversity of health agency structures and resources make this a challenge, increased attention to these details will help when designing and tracking progress on the HP 2010 objectives. Health agencies also vary in their capacity to monitor the objectives they identify as most relevant to their missions.
Setting Priorities
Determining health priorities helps direct resources to the programs that matter most to communities--those that will have the greatest impact on the health status of the population. Probably the most difficult task in the Healthy People 2010 planning process is reaching consensus on health priorities and creating realistic objectives to address the priorities. A sound priority-setting process that is well publicized and documented helps achieve widespread support and endorsement for the plan.
Many health concerns compete for limited resources -- not enough to meet all the needs and demands for preventive and treatment services. Although dental professionals believe that oral health should be one of the top health priorities, as dental diseases affect most of the population, oral health often ends up on the bottom of the list. Why? Until recently, oral health has not had a broad base of advocates on a national level clamoring that it is a major health concern. States and communities have been more successful, creating coalitions to increase the visibility of oral health disparities and planning innovative strategies to reduce the prevalence of dental disease.
Many priority-setting methods exist for creating HP 2010 objectives:
- Delaware used a method that asks questions and creates a formula for prioritization based on:
- size of the health problem
- seriousness of the problem
- potential for interventions to impact the public’s health.
They weighted the seriousness of the health problem as twice the importance of the size of the health problem. The most important criterion was the effectiveness of interventions according to a review of the scientific literature. The State Healthy People 2010 Tool Library includes examples of other useful frameworks and options that Delaware and other states used to set their Healthy People 2010 priorities.
Maryland used a ranking system (i.e., 1-5) to compare state-specific health indicators to national health indicators as "better than," "same as," or "worse than," and then to arrive at a consensus set of health indicators. Their 24 local jurisdictions also used the same process. Counties, communities or tribes can compare their health indicators to state, territorial or regional rates.
Kansas is using input from committees and groups formed during HP 2000 implementation. They also are using objectives from their state Injury Plan, Tobacco Control Plan and Cancer Plan.
Two American Indian tribes in Wisconsin formed committees consisting of tribal health clinic staff, teachers, tribal community leaders, and others. Each committee then identified priority issues and used the Healthy People 2000 and HP 2010 documents to formulate their objectives. Experts from the field also provided input.
Another framework used by one of the counties in Maryland is the PEARL Framework, a socioeconomic, legality and political viability tool. The framework looks at:
Ways to Gather Input to Make Decisions on Health Priorities
- compile and evaluate existing health data
- seek expert opinion
- invite public comment
- conduct opinion surveys
P = propriety; is an intervention suitable?E = economics; does it make economic sense to address this problem?A = acceptability; will this community accept an emphasis on this problem and will they accept the proposed intervention?R = resources; are funding and other resources available or potentially available?L = legality; do the current laws allow the intervention to be implemented, and if not, is it worthwhile to expend time, energy and resources working for legislative and regulatory change?
Source for Maryland example: HP 2010 Toolkit, http://www.health.gov/healthypeople/state/toolkit/priorities.htm#Priority Setting in Maryland
Source for the PEARL Framework: Vilnius, D., Dandoy, S. "A Priority Rating System for Public Health Programs." Public Health Reports, 105(5):463-470, 1990.
This approach seems to be especially relevant to oral health priorities and interventions that address access issues and reduction of oral health disparities.
Choosing Target Populations
 Several types of target populations are used for national Healthy People 2010 objectives. This is important to know when developing state or other HP 2010 objectives whose outcomes you plan to compare to the national objectives. Note that populations in the US territories or protectorates are not included in these definitions.
Resident Population
The resident population includes all persons whose usual place of residence is in one of the 50 States or the District of Columbia, including Armed Forces personnel stationed in the United States. The resident population is usually the denominator when calculating birth and death rates and incidence of disease rates from a number of data sources. The resident population also is the denominator for selected population-based rates that use numerator data from the National Nursing Home Survey.
Civilian Population
The civilian population is the resident population, excluding members of the Armed Forces (although their family members are included). The civilian population is the denominator for other Healthy People 2010 data sources, such as the National Hospital Discharge Survey.
Civilian, Noninstitutionalized Population
The civilian, noninstitutionalized population is the civilian population not residing in institutions (e.g., correctional facilities, psychiatric hospitals, and nursing homes). This population is the denominator for rates from Healthy People data sources such as the National Ambulatory Medical Care Survey and the National Hospital Ambulatory Care Survey. This population is also used in the weighting procedure to produce national estimates from health surveys such as National Health Interview Survey and National Health And Nutrition Examination Survey (see survey descriptions on pages 14-15).
Populations will differ for various oral health objectives; some objectives may be targeted to a very narrow age group or special population group. When drafting a HP2010 plan and objectives, state clearly which populations are targeted and why. Remember that a goal of the HP 2010 initiative is to reduce health disparities, so make sure to include groups that have the greatest health disparities.
Criteria for Developing Objectives
- The results to be achieved should be important and understandable to a broad audience and relate to the Healthy People 2010 goals, objectives and focus areas.
- Objectives should be prevention-oriented and should address health improvements that can be achieved through population-based and health-service interventions.
- Objectives should drive action and suggest a set of interim steps that will achieve the proposed targets within the specified timeframe.
- Objectives should be useful and relevant. States, localities, and the private sector should be able to use them to target efforts in schools, communities, worksites, health practices, and other settings.
- Objectives should be measurable and include a range of measures -- health outcomes, behavioral and health service interventions, and community capacity -- directed toward improving health outcomes and quality of life. They should count assets and achievements and look to the positive.
- Continuity and comparability are important. Whenever possible, objectives should build upon Healthy People 2000 and those goals and performance measures already adopted.
- There must be sound scientific evidence to support the objectives.
Source: U.S. Department of Health and Human Services, Office of Disease Prevention and Health Promotion. Developing Objectives for Healthy People 2010, 1997.
Nationally, increasing emphasis is being placed on evidence-based approaches to prevention and treatment of oral diseases. A number of citations in the References included in the Resources section provide some guidance about levels of effectiveness of certain community-based approaches to preventing oral diseases. In some cases, insufficient research has been conducted to be able to determine effectiveness. Check the scientific literature periodically for updates that might influence your decisions.
 Selecting Oral Health Objectives
The manner in which states and communities have accepted the HP 2010 challenge varies considerably. Table 3.1 shows some of the variations in the number of overall objectives, focus areas and oral health objectives. This table does not include all states with oral health objectives. Links to state HP 2010 Web sites can be accessed on the Healthy People Web site. Sometimes it is difficult to locate the oral health objectives in state plans if there is not a separate focus area devoted to oral health.
Table 3.1. Number of HP 2010 Overall Objectives, Focus Areas, and Oral Health Objectives in Selected States | State | HP2010 Overall Objectives | Oral Health Objectives |
|---|
| Alabama | 47 objectives in 4 topic areas | 2 |
|---|
| Arizona | 52 objectives in 12 health areas | 5 |
|---|
| Kentucky | 350 objectives in 26 focus areas | 14 |
|---|
| Maine | 75-100 objectives in 10 focus areas | 5 |
|---|
| Minnesota | 200 objectives for 18 goals (areas) | 7 |
|---|
| New Hampshire | 61 objectives in 11 focus areas | 2 |
|---|
| New Jersey | 142 objectives in 19 areas | 1 |
|---|
| North Carolina | 110 objectives in 12 focus areas | 5 |
|---|
| Vermont | 82 objectives in 16 priority areas | 6 |
|---|
In some instances, states adapted the national objectives to make them more relevant to their population’s needs or to correspond to previously collected baseline data. For example:
- Kentucky added the age group of 12-year-olds to the oral health objectives for children and expanded the cleft palate objective to include children with other craniofacial anomalies.
- Iowa included a number of objectives for seniors over the age of 75.
- Minnesota and Iowa are tracking deaths from oral and pharyngeal cancer but not oral screening rates or stage at detection.
In other cases, states have developed objectives that differ from any of the national objectives. For example:
- Arizona and Minnesota are measuring the proportion of the population with comprehensive dental insurance.
- Iowa is assessing untreated root caries in seniors.
- Iowa has an objective for increasing oral health screening and preventive counseling for 1-year-old children by qualified health professionals.
- Kentucky has an objective specific to Family Resource Centers and Youth Service Centers providing screenings, referrals and follow-up.
Examples of specific oral health objectives used by some states are included in the Resources section. Also included is a worksheet for drafting oral health objectives. When drafting objectives, do not forget to review the related objectives from other focus areas, especially those for cultural competence, health communication, diabetes, public health infrastructure, access, injury and violence prevention.
Establishing a Needs Assessment Plan and Obtaining Baseline Data
HP 2010 can act as an impetus to enhance the availability of valid, coordinated, useful data that can then be used to track oral health outcomes. One important step in developing objectives is to determine what baseline data already are available. Use a variety of sources to determine this:
- Healthy People 2000 and 2010 documents and databases
- National, state, and local surveys, surveillance systems, and registries
- Community partners with their own databases (e.g., hospitals, community clinics, schools).
Community partnerships are important for identifying gaps in information, helping to gather information on hard-to-reach populations, and assuring that information is collected in a culturally sensitive and appropriate manner.
Use the section in this chapter on Resources for Data and Assistance to help locate data.
The following considerations can be used for judging if existing data are suitable for establishing baselines or using in a needs assessment process:
- Reliability: How accurate and complete are the data?
- Timeliness: What is the most recent year and for what other years are data available?
- Representativeness: Is there a reason to believe the data are no longer representative?
- Comparability: Can you compare these data with other data you plan to use (e.g., standard definitions, similar collection methods)?
- Linkage: Do these data contain identifiers that will permit linkage with other data (e.g., patient identifiers, census tracts)?
- Variability: Have any data elements changed (e.g., definitions, reporting requirements, collection methods)?
- Confidentiality: Do the data implicitly or explicitly identify individuals?
- Automation: To what extent are the data computerized and what hardware/software is required to transfer/translate data files?
Source: Association of State and Territorial Dental Directors. Assessing Oral Health Needs. ASTDD Seven-Step Model. Columbus, OH: ASTDD. 1995.
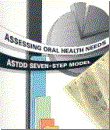 To assist states in performing oral health needs assessments, the ASTDD developed Assessing Oral Health Needs. ASTDD Seven-Step Model. This document provides an organized approach to planning and implementing an oral health needs assessment as well as analyzing and reporting data from the process. Although written primarily for states, communities and other groups will also find it useful. An updated version that includes a new section on prioritizing needs is available on the ASTDD Web site at www.astdd.org/index.php?template=seven_steps.html. The Resources section of this chapter includes a helpful handout from the ASTDD Seven-Step Model that summarizes these methods in terms of purpose, cost, time involvement and advantages. A similar summary that includes a few other techniques is included in the textbook, Community Oral Health Practice for the Dental Hygienist, cited in the References list.
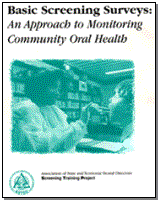 In 1999 ASTDD, in conjunction with the Ohio Department of Health, produced Basic Screening Surveys: An Approach to Monitoring Community Oral Health. The Basic Screening Survey (BSS) is a standardized set of surveys designed to collect information on the observed oral health of participants, self-report or observed information on age, gender, race and Hispanic ethnicity, and self-report information on access to care for preschool, school-age, and adult populations. The surveys are cross-sectional and descriptive. Observations of gross dental or oral lesions are made by dentists, dental hygienists, or other health care workers in accordance with state law. The examiner records presence of untreated cavities and urgency of need for treatment for all age groups. For preschool children, presence of early childhood caries, including white spot lesions, and caries experience are recorded. For school-age children, presence of sealants on permanent molars and caries experience are recorded. Edentulism (no natural teeth) is recorded for adults.
One or more of the surveys in the BSS can be used to obtain oral health status and dental care access data at a level consistent with monitoring Healthy People 2010 objectives. As of October 2002, about 30% of states have used or are in the process of using the BSS, and more are planning to use it. Training materials, including a video and manual are provided with the Basic Screening Surveys, available for purchase on the ASTDD Web site. Technical assistance on sampling and analysis is available on a limited basis through ASTDD to states and others undertaking these surveys using the standard protocol.
A number of states have conducted statewide oral health needs assessments and published reports of their methodology and findings, some of which include county-specific data. Many of these reports are available online at www.mchoralhealth.org or through Web sites of state oral health programs (access via direct links on ASTDD Web site). Some state examples include Washington, Oregon, Ohio, California, New Hampshire, North Carolina, Kentucky, Maine, Maryland, Iowa, Alabama, and Texas.
Most states have conducted some form of open-mouth survey with convenience samples or a carefully selected sampling framework. These may have been on a statewide basis, in counties or cities, or in specific school systems or other community-based programs. They may be done on a sporadic basis, on a regular cycle such as every five years, or as part of an oral health surveillance system.
Selecting samples is one of the most difficult decisions for states and communities wishing to conduct surveys, especially when funds are limited. It is wise to consult with a statistician or epidemiologist when making these decisions.
One important factor to plan for is the significant time involvement for planning, conducting and analyzing information from an oral health needs assessment -- often more than a year. Discuss the entire process with others who have done surveys, and solicit technical assistance to assure that you have a well-developed plan and adequate resources.
Two examples show how states have used or adapted the Seven-Step Model or the Basic Screening Survey.
Arizona
The Arizona Department of Health Services Office of Oral Health has developed a state oral health surveillance system based on the Basic Screening survey. They have published a small booklet, Guidelines for Oral Health Screenings and a training guide for the BSS. They monitor the oral health status of school-age children in communities greater than 1,000 residents by surveying a stratified random sample of children attending grades K to 3 in public schools. Data elements include demographics (age, gender, grade, community/school, dental insurance, race/ethnicity, last dental visit, household yearly income, number of people in home) and oral health indicators (DMFS/dfs, untreated decay, decay experience, sealants present, sealants needed, treatment urgency, and fluorosis). Data are updated every three years.
Contact: AZ Office of Oral Health, 602-542-1866
Illinois
Illinois has used the ASTDD Seven-Step model and a supplemental guide that they developed to assist communities throughout the state to assess oral health status and needs and to develop comprehensive community-specific oral health plans. Since 1996, 48 grantees representing 59 communities and 7.4 million people have participated in this survey. Each community uses a planning group to look at existing data, collect primary data, and consider community perception of need. This approach has resulted in a ground swell of community-based oral health programs and activities around the state to address HP 2010 objectives.
Contact: Lew Lampiris at llampiri@idph.state.il.us
Setting Target Levels for Objectives
One of the central issues many states struggle with when developing objectives is how to set achievable, realistic targets for outcome, performance, and process objectives. This task requires decisions based on a comparison of data available for your state, territory, tribe or community with regional or national data. A handout in the Resources section, adapted from information included in the HP Toolkit 2010, explains how the national objectives were set for population objectives, health outcomes and performance objectives, and process objectives. Another handout in the Resources Section provides an example of how target levels were set by the Indian Health Service for some of their objectives.
Once target objectives are set, it is important to track progress on these levels periodically to determine if they were realistic and if they need to be adjusted. Chapter 6 discusses this topic and provides examples.
Tip
Set challenging, yet realistic, targets for your objectives:
- Identify lessons learned from the year 2000 targets (e.g., how many were too ambitious or not ambitious enough, how many had to be reset or deleted and why).
- Use previously identified performance measurements.
- Use existing agency or program-specific benchmarks.
- Set targets to eliminate population health status disparities.
- Use applicable national Healthy People 2010 targets.
- Use other statistical methods covered in the handout in the Resources section.
Evaluating Data: Data Issues and Uses
Involving evaluation specialists and epidemiologists in your HP 2010 planning group is crucial to making sure that your plan for collecting, analyzing and reporting data is well thought out and technically accurate. Unfortunately, many health professionals find issues related to data and evaluation daunting, and either ignore them or postpone making decisions. Poor planning in this regard can sabotage the outcomes of your entire HP 2010 plan.
These are some general data issues that you may want to address:
Data Quality – When using new data collection systems, be sure to check for standardization of data collection and recording, data management and analysis, and structure and content of questions.
Limitations of Self-Reported Data – When relying on self-reported data such as income level, use of fluorides, or health screening behaviors, be aware of self-reporting bias. Measures will vary based on the type of data collection (written survey, telephone interview, direct observation, etc.).
Data Validity and Reliability – Revision of survey questions and the development of new data collection systems will require careful validity and reliability testing. In monitoring efforts, the validity of responses over time may also become an issue.
Periodicity of Data Availability – Data collection efforts are not always performed on a regular basis. Take this into consideration when planning your dissemination and communication efforts.
Timeliness of Data Availability – As previously stated, this is not always possible, but still important. It helps to be able to regularly identify progress and areas that may need additional efforts.
Representativeness of Data – Special considerations need to be made when collecting data for specific population groups or local communities. Do responses collected represent those individuals of interest?
Small-Area Analysis – This takes into account the limitations of applying national data to the state, local and community levels. This pertains to using small numbers in one’s statistics. Poisson distribution, non-parametric statistics, and standardized mortality rates/ratios (SMRs) may be appropriate methodologies.
Source: Committee on Leading Health Indicators for Healthy People 2010. Leading Health Indicators for Healthy People 2010: Final Report. Division of Health Promotion and Disease Prevention, Institute of Medicine, 1999.
Evaluate your existing data collection methods using these guidelines:
- Simplicity
- Flexibility
- Data quality
- Acceptability
| - Sensitivity
- Predictive value positive
- Representativeness
| |
Source: Guidelines Working Group. Updated guidelines for evaluating public health surveillance systems. MMWR. 50(RR13):1-35, July 27, 2001.
A table is included in the Resources section that outlines technical and strategic characteristics of data that are important for policy making.
Summary checklist for setting priorities, establishing objectives, obtaining baseline measures, and setting targets
- Solicit and evaluate input from community partners and experts
- Establish criteria and a process for final determination of priorities
- Set criteria for evaluating existing public and private data sources for baseline measures, and inventory these sources
| - Review progress in achieving Healthy People 2000 objectives
- Conduct assessments of health needs, if necessary, to establish baselines
- Develop draft objectives
- Develop targets with appropriate baselines and measures
|
Resources for Data and Assistance
Many partners can help you locate, and process and/or analyze data. These include:
- National agencies and organizations such as NIDCR, CDC, ASTDD, ADA, ADEA, Council of State and Territorial Epidemiologists
- State centers for health statistics
- State cancer registries
- Health department statisticians, epidemiologists, and program directors
- Health data analysts at local, state, and national levels
- Other local and state government agencies
- Academic partners, e.g., schools of public health, dental schools
- Dental managed care and dental insurance companies
Publications that include an overview of oral health problems, such as the HP 2010 Oral Health chapter and the Surgeon General’s Report on Oral Health, cite numerous data sources. A guide to federal health information centers and clearinghouses that focus on specific topics and provide minority health data is available through the USDHHS Office of Minority Health. Information on children and populations with special health care needs is available online through the National Oral Health Information Clearinghouse (NOHIC) at http://028.nihmcmspauth2.cit.nih.gov/www.nidcr2.nih.gov/OralHealth/OralHealthInformation/SpecialNeeds/ and the National Maternal and Child Oral Health Resource Center at www.mchoralhealth.org. The Pan American Health Organization has published a monograph that includes annotated bibliographic entries of articles in 25 oral health categories (citation on page 12 of this chapter’s Resources section.)
If specific articles are needed for background information or data, the US National Library of Medicine (NLM) provides free access to Medline and additional life sciences journals. NLM Gateway provides a single online access point for the multiple information resources of the NLM at gateway.nlm.nih.gov/gw/Cmd. Locatorplus is an on-line catalog of the library’s holdings of monographs, journals and audiovisuals. DOCLINE is the automated interlibrary loan request, routing and referral system that individuals can use, usually for a fee.
The following section provides an overview of some other national resources for oral health data
Centers for Disease Control and Prevention (CDC)
A good overview of information available through CDC is in the Spring/Summer 2001 issue of Chronic Disease Notes and Reports on the CDC Web site at www.cdc.gov/nccdphp. In 1991, the Health Promotion Statistics Division was established at CDC/National Center for Health Statistics (NCHS) to monitor Healthy People 2000. Staff in this unit coordinate with the HHS lead agencies in collecting and reporting on the national Healthy People objectives.
DATA2010is an interactive database system that contains the most recent monitoring data for Healthy People 2010. It now contains national data for all the objectives and subgroups, but state data may be available for selected objectives in the future. Users can search by objectives within a focus area, objectives by data source, specific population groups, and key words. The database is updated quarterly and is hosted on CDC’s Wonder data system. You can access the system from the Healthy People Web site via the DATA 2010 link. At the CDC Wonder login screen, enter your Wonder user ID or select Anonymous User. This forwards you to the database.
NHANES: Oral health data were collected in the National Health and Nutrition Examination Survey (NHANES I, NHANES III, and NHANES IV)(www.cdc.gov/nchs/express.htm).
- NHANES I was conducted between 1971 and 1975. This survey was based on a national sample of about 28,000 persons between the ages of 1 and 74. Extensive data on health and nutrition were collected by interview, physical examination, and laboratory analyses. The sampling design of NHANES I did not include persons of Hispanic/Latin origin.
- NHANES III, conducted between 1988 and 1994, included about 40,000 people selected from households in 81 counties across the United States. To obtain reliable estimates, infants and young children (aged 1 to 5 years), older persons (aged 60 years and older), Black Americans and Mexican Americans were sampled at a higher rate. NHANES III also placed an additional emphasis on the effects of the environment on health.
- NHANES IV began in April 1999 and will be a continuous survey visiting 15 U.S. locations per year. Approximately 5,000 people will be surveyed annually.
- Hispanic Health and Nutrition Examination Survey (HHANES) was a national survey from 1982 through 1984 of approximately 16,000 Hispanic persons in three subgroups, 6 months to 74 years of age. Hispanics were included in past health and nutrition examinations, but neither in sufficient numbers to produce estimates of the health of Hispanics in general, nor specific data for Puerto Ricans, Mexican Americans, or Cuban Americans. HHANES was conducted in selected areas of the United States rather than as a national probability sample.
Data from the HHANES are generally organized by the data collection method (e.g., Child Sample Person Questionnaire or Dental Examination). The data files comprising the HHANES include a number of demographic and socioeconomic variables on each tape, including age, gender, ethnicity, income, education, and marital status. Data are available on the NCHS Web site as public use data files.
National Health Care Survey, is an integrated survey of health care providers formed from the merger of four existing surveys: the National Hospital Discharge Survey, the National Ambulatory Medical Care Survey, the National Nursing Home Survey and the National Health Provider Inventory. New surveys added to the database include: the National Survey of Ambulatory Surgery, National Hospital Ambulatory Medical Care Survey, National Home and Hospice Care Survey, and National Employer Health Insurance Survey. All surveys are described on the NCHS Web site.
The National Health Interview Survey (NHIS) is a cross-sectional household interview survey on the health of the civilian noninstitutionalized population of the United States. The sampling plan follows a multistage area probability design that permits the representative sampling of households. NHIS data are collected annually from approximately 43,000 households including about 106,000 persons. Information on the survey can be found on the NCHS Web site.
Oral Health Resources Data Systems monitor the prevalence of oral diseases and the factors influencing oral health, such as risky or protective behaviors, the availability of preventive interventions and utilization of preventive services. The systems bring together existing data from multiple national and state sources and present the data in useful and accessible formats for the broad community interested in promoting oral health. Some of the systems that are linked include the fluoridation census information and WFRS (described next) and the NOHSS and state synopses (described under ASTDD).
The Fluoridation Census provides the fluoridation status for each state. States report each fluoridated water system and the communities each system serves; the status of fluoridation -- adjusted, consecutive, or natural; the system from which water was purchased, if consecutive; the population receiving fluoridated water; the date on which fluoridation started; and the chemical used for fluoridation, if adjusted. Data from the 2000 census was posted in early 2002 and can be accessed online at http://apps.nccd.cdc.gov/MWF/Index.asp.
Water Fluoridation Reporting System (WFRS) is an Internet-based tool through CDC that allows state and tribal fluoridation managers to login, enter data, and monitor fluoridation quality. Because the requirements for monitoring vary widely among tribes and states, WFRS allows managers to enter their own criteria to use when determining if a system is optimal. The system displays data on the state-specific proportion of persons on public water systems who receive fluoridated drinking water. A public water system is a system that provides piped water for human use and regularly serves at least 25 people or has at least 15 service connections. WFRS can print standard reports or customized reports. Not all states and territories are currently participating in WFRS. Public access to WFRS is still under construction. CDC plans to use Geographic Information Systems software to place state and county-based fluoridation information on-line.
Pregnancy Risk Assessment Medical Survey (PRAMS)collects state-specific, population-based data on maternal attitudes and experiences prior to, during, and immediately following pregnancy. The PRAMS sample of women who have had a recent live birth is drawn from the state's birth certificate file. Each participating state samples between 1,300 and 3,400 women per year. Women from some groups are sampled at a higher rate to ensure adequate data are available in smaller but higher risk populations. Selected women are first contacted by mail. If there is no response to repeated mailings, women are contacted and interviewed by telephone. Data collection procedures and instruments are standardized to allow comparisons between states. PRAMS provides data for state health officials to use to improve the health of mothers and infants. PRAMS allows CDC and the states to monitor changes in maternal and child health indicators (e.g., unintended pregnancy, prenatal care, breastfeeding, smoking, alcohol use, infant health). Data are collected on dental visits and dental cleanings during pregnancy. As of 2002, 33 states were participating in PRAMS.
Youth Risk Behavior Study (YRBS) is a school-based survey conducted biennially to assess the prevalence of health risk behaviors among high school students. YRBS includes national, state, territorial and local school-based surveys of high school students. The school-based survey employs a cluster sample design to produce a representative sample of students in grades 9 – 12. Survey procedures are designed to protect the students’ privacy by allowing for anonymous and voluntary participation. Forty-two states were participating in this survey in 1999. A sample analysis of oral health survey findings from North Dakota is included in the Resources section (page 10) and available on their Web site. National information is available online at www.cdc.gov/HealthyYouth/yrbs.
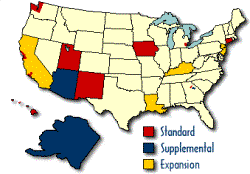
Behavioral Risk Factor Surveillance System (BRFSS) is a state-based, ongoing data collection program designed to measure behavioral risk factors in the adult, noninstitutionalized population 18 years of age or older. Every month, states select a random sample of adults for a telephone interview. This selection process results in a representative sample for each state so that statistical inferences can be made from the information collected. The BRFSS gathers data on dental visits, teeth cleaning, edentate status, and no tooth loss. The following states have added additional oral health questions to their BRFSS survey.
- Alaska
- California
- Idaho
- Indiana
| - Louisiana
- Massachusetts
- Montana
- Oregon
| - South Dakota
- Utah
- West Virginia
|
Information is available online at www.cdc.gov/brfss. Users can search the annual data by state, year and category. Trends tables, prevalence tables, BRFSS at a Glance and publications are also posted. A few case studies are included of how states and communities have used BRFSS data to support Healthy People objectives and to initiate changes to improve health. An example of how Texas has used BRFSS data to highlight risk factors for oral cancer is included in the Resources section and is available online at http://www.dshs.state.tx.us/dental/.
State Tobacco Activities Tracking and Evaluation System (STATE) is an electronic data warehouse containing up-to-date and historic state-level data on tobacco use prevention and control. It is designed to integrate many data sources to provide comprehensive summary data and to facilitate research and consistent interpretation of the data. The STATE System was developed by CDC, NCCDPHP, Office on Smoking or Health. Data are gathered annually for most data sources, quarterly for state tobacco control legislation. National estimates specifically for Healthy People 2010 are derived by summing the state numbers (for example, number of smokefree indoor air policies) across states. The Web site is www.cdc.gov/tobacco. Another helpful resource on the Web site is the report, Investment in Tobacco Control: State Highlights 2001. It provides state-based information on the prevalence of tobacco use, health impacts and costs associated with tobacco use, tobacco control funding, and tobacco excise tax levels for all 50 states and the District of Columbia.
National Center on Birth Defects and Developmental Disabilities monitors the occurrence of major structural birth defects (including cleft lip and palate) through an ongoing surveillance system, and provides technical assistance to states. The Developmental Disabilities Section conducts surveillance and epidemiologic research on developmental disabilities and selected adverse reproductive outcomes. Since 1998 CDC has awarded three-year cooperative agreements to 26 states to address major problems that hinder the surveillance of birth defects and the use of data for prevention and intervention programs. States received funding for three categories of activities; 1) to initiate new surveillance programs where none existed (Louisiana, Maine, Montana, Nevada, New Hampshire, Wisconsin); 2) to support new programs (Florida, Kentucky, Missouri, New Mexico, North Carolina, South Carolina, Utah); and 3) to improve existing surveillance programs (Arizona, Arkansas, Colorado). The agency Web site is www.cdc.gov/ncbddd, but the state-based birth defects surveillance data reports are available at www.nbdpn.org/NBDPN.
National Cancer Institute (NCI), National Institutes of Health (NIH)
Cancer information can be accessed via a number of NCI Web sites. Aggregate information on more than 50 types of cancer, including facts about treatment, detection, prevention, statistics, etc. can be viewed online at www.cancer.gov/cancerinformation/cancertype. CANCERLIT 7 - (www.cancer.gov/search/cancerliterature) is a searchable literature bibliographic database that is updated monthly.
The Surveillance, Epidemiology and End Results Program (SEER) and State Cancer Registries currently collects and publishes cancer incidence and survival data from 11 population-based cancer registries and three supplemental registries covering approximately 14% of the U.S. population.
 Alaska
 - Atlanta
- Rural Georgia
- Arizona
- Connecticut
- Detroit
- Hawaii
- Iowa
- Kentucky
- Louisiana
- New Jersey
- New Mexico
- San Francisco-Oakland
- San Jose-Monterey
- Los Angeles
- Remainder of California
- Seattle-Puget Sound
- Utah
Information on more than 2.5 million in situ and invasive cancer cases is included in the SEER database, and approximately 160,000 new cases are added each year within the SEER catchment areas. The SEER registries routinely collect data on patient demographics, primary tumor site, morphology, stage at diagnosis, first course of treatment, and follow-up for vital status. Data are reported for oral and pharyngeal cancer by stage at diagnosis and mortality rates per year. The SEER Program is the only comprehensive source of population-based information in the United States that includes stage of cancer at the time of diagnosis and survival rates within each stage. The mortality data reported by SEER are provided by the National Center for Health Statistics. SEER data are updated annually and provided as a free public service in print and electronic formats. The SEER Program provides cancer incidence, mortality, and survival data in an annual cancer statistics review, in monographs on relevant topics, through the SEER Web site, in various specially-developed software packages (e.g., SEER*Stat, SEER*Prep), and in a public-use data file.
National Institute of Dental and Craniofacial Research
National Survey of Oral Health in Employed Adults and Seniors was conducted by NIDR during 1985-86 to assess the oral health status of US employed adults and noninstitutionalized persons aged 65 and older. NIDR-trained dentists performed clinical measurements for coronal caries, root caries, periodontal destruction and tooth loss. Demographic and selected health data, including frequency of dental visits, were collected for both dentate and edentulous persons. The sample of over 15,000 employed adults examined in this survey represented almost 100 million employed persons in the United States. Employed adults were examined at their participating business establishments. The sample of over 5,000 seniors represented over 4 million older persons. The seniors consisted of persons 65 years of age and older who attended selected multi-purpose senior centers within a designated 12-month period. This survey was the first national dental survey to provide detailed information on root caries and periodontal diseases.
US School Children Survey. The primary objective of the 1986-87 survey was to provide reliable statistics on the level of dental caries in US schoolchildren (excluding Alaska). A second objective was to evaluate recent progress in reducing caries by comparing the survey data to that from a previous NIDR survey. Additionally, the survey was designed to provide estimates of the prevalence of gingivitis, dental fluorosis, periodontal destruction, and soft tissue lesions in the school-aged population. NIDR-trained dentists performed oral examinations on 40,693 students aged 4 to 22 at schools throughout the US. The sample represented approximately 45 million school children. Questionnaires completed by the children’s parents provided extensive residential histories and information on fluoride exposure. Data on smoking history and current use of smokeless tobacco, cigarettes and alcohol were collected from students in grades 6 through 12. These data were collected in personal interviews conducted with the students at the conclusion of their oral examinations.
The Dental, Oral, and Craniofacial Data Resource Center, sponsored by the NIDCR and the CDC Division of Oral Health, has produced a Catalog of Surveys Related to Oral Health. The catalog is a compilation of federal, state, international and other surveys focusing on oral health or containing an oral health component. The database is available in Microsoft Access 97 and Microsoft Access 2000 on a CD ROM. The list of oral health variable fields is included in the Resources section. The information is also available online at http://drc.nidcr.nih.gov/.
Health Resources and Services Administration (HRSA) maintains a number of databases, from which they post information on various Web sites.
HRSA Bureau of Primary Health Careprovides information on Dental Health Professional Shortage Areas (HPSAs) and location of community health centers at http://bphc.hrsa.gov/.
HRSA Bureau of Health Professions, State Health Workforce Profiles, are displayed at http://bhpr.hrsa.gov/healthworkforce/reports/profiles. These state-based profiles compile accurate and current data on supply, demand, distribution, education and use of health personnel, including dental personnel in the 50 states and the District of Columbia. Estimated numbers of workers indicate the size of the state’s health workforce. Per capita ratios facilitate comparisons with other states and the nation. A companion Resource Guide helps you use the data and directs users to sources of more detailed data that address different health workforce issues. A few sample pages from one state’s (California) 2000 publication are included in the Resources section.
HRSA Maternal and Child Health Bureau is helping states map their capacity to provide health services to children. Geographic Maps will be linked with existing data to dramatically illustrate areas where families have inadequate access to services such as dental care. Maps will be posted on the HRSA Web site as they are developed. Title V Information System (Title V IS) electronically captures data from annual Title V Block Grant applications and reports submitted by all 59 States and Territories. Reach the online database through www.ncemch.org/titlevis/default.html, which allows users to search and sort data on key measures of health status for mothers and children, including oral health. Information can be searched and sorted by state, performance measures, types of services, levels of spending and other categories.
Indian Health Service (IHS) maintains a computerized patient registration database, the Resource and Patient Management System (RPMS), in a searchable database at each IHS clinical facility. It contains information from pharmacy prescriptions, laboratory results, radiology reports and patient encounters (history, physical exam and therapeutic interventions). An ICD-9 code is used to record the purpose of each visit.
- In 1999 IHS conducted an oral health survey of 13,000 American Indian and Alaska Native dental patients aged 2-96 years. These data are available on the IHS Web site at http://www.ihs.gov/MedicalPrograms/Dental/downloads/Oral_Health_1999_IHS_Survey.pdf
 . A more general publication, Regional Differences in Indian Health, 1998-99, presents tables and charts, including information on dental services, displayed by IHS Area.
Agency for Healthcare Quality and Research (AHQR)
- The Medical Expenditure Panel Survey (MEPS) comprises four linked, integrated surveys, most of which have at least some oral health or dental care information:
- Household Component (HC): Computer-assisted, in-person interviews; health conditions, health status, use of medical care services, charges and payments, access to care, satisfaction with care, health insurance coverage, income, and employment.
- Medical Provider Component (MPC): Telephone interviews and mailed surveys; Information on medical care events from medical providers identified by HC respondents, including expense information for events covered under various managed care plans.
- Insurance Component (IC): Telephone interviews and mailed surveys; data on types of health insurance plans, associated premiums, and numbers of plans offered.
- Nursing Home Component (NHC): The 1996 NHC gathered information from a sample of nursing homes and residents on characteristics of the facilities and services offered; expenditures and sources of payment for individual residents; resident characteristics, including functional limitation, cognitive impairment, age, income and insurance coverage. Data were also collected on availability and use of community-based care prior to admission to the nursing home.
- Each year, the MEPS HC sample is a nationally representative subsample of the National Health Interview Survey (NHIS), which uses a stratified multistage probability design that permits a continuous sampling of 358 primary sampling units. The 1996 HC collected data on 10,500 families and 24,000 individuals who participated in the 1995 NHIS. The MPC bases its sample on the HC. The IC partially bases its sample on the HC. Data are obtained through employers, unions, or other private health insurance sources identified by the HC respondents. The MEPS homepage is www.meps.ahrq.gov.
The Centers for Medicare and Medicaid Services (CMS) provides data on national spending on health care, including dental health services. Data on Medicaid spending are available online at www.cms.gov/medicaid/mcaidsad.asp and SCHIP statistics are available at www.cms.gov/schip/. CMS publishes a booklet each year that includes statistics about dental expenditures by region. Data to 1998 from the HCFA 416 form are posted on the Web site. More recent state-specific and county-specific Medicaid claims data may be available through each State Medicaid program for the proportion of Medicaid eligible children who had a dental visit or a preventive visit (prophylaxis, topical fluoride treatment, or dental sealants). Data from the CMS Minimum Data Set (MDS), used to assess each nursing home facility resident’s health, are available, but appear to under-represent the actual oral health status of residents. (see Folse article cited on page 20 of the Resources section for this chapter).
Other Federal Web sites
Fed Stats is a Web site that provides a direct link to statistics of states, counties, congressional districts, federal judicial districts and some local data. It also links to statistical agencies.
First Gov is a useful Web site for links to all types of federal, state, local, tribal and international agencies, including phone directories and laws and regulations.
Other Data Sources
National associations and national centers also collect or house information.
The Center for Health and Health Care in Schools is a program and resource center located at George Washington University. Data are available on school-based health centers, especially from a school-year 1999-2000 survey of 50 states. See their Web site at www.healthinschools.org.
The National Maternal and Child Oral Health Resource Center, also housed at Georgetown University, houses an extensive collection of publications on the oral health of children. See the list of publications on their Web site at www.mchoralhealth.org.
The American Dental Association and the American Dental Education Association publish the results of numerous surveys of their members. See their Web sites at www.ada.org/prof/prac/issues/surveys/indes.html and www.adea.org for a list of their publications. The ADA Survey Center collects, analyzes, and disseminates statistics and trends affecting dentistry. Most are random sample surveys for general practitioners and specialists. Topics in the publication catalog include dental practice, dental health policy analysis, workforce issues, education and institutional issues. Other potential sources of oral health data are Schools of Dentistry and some Schools of Public Health.
Association of State and Territorial Dental Directors (ASTDD) National Oral Health Surveillance System. This cooperative project between CDC and ASTDD is designed to help public health programs monitor the burden of oral disease, use of the oral health care delivery system, and the status of community water fluoridation on both a state and national level. NOHSS includes indicators of oral health, guidelines for oral conditions and oral health care, information on state dental programs, and links to other important sources of oral health information. Eight basic oral health surveillance indicators are the main focus:
- Dental visits
- Teeth cleaning
- Complete tooth loss
- Fluoridation status
- Dental caries experience
- Untreated dental caries
- Dental sealants
- Cancer of the oral cavity and pharynx.
Data can be displayed in tables, graphs, and maps for the nation and for the state, or in combination, e.g., compare state data to national data or compare data from two states. Data sources for NOHSS include national surveys (NHANES, NHIS, Fluoridation Census) and state-based surveys (BRFSS, YRBSS, PRAMS, ASTDD’s Basic Screening Survey, and annual State Synopses). Each of these surveys is described in detail in this section. The NOHSS is accessed online at www.cdc.gov/nohss.
ASTDD Synopses of State and Territorial Dental Public Health Programs. This information is available on the CDC Web site at www2.cdc.gov/nccdphp/doh/synopses/index.asp. Data are updated once a year by submissions from state and territorial oral health programs. In some cases data are from national sources (e.g., American Dental Association), or data may be unavailable or missing because information was not submitted. Data are displayed by individual states/territories. An interactive national trend table aggregates that information to track changes over time. Maps display which states conduct each of 12 types of oral health activities and which states have full-time dental directors. Categories of data include:
- Demographics: e.g., number of Medicaid and SCHIP eligibles and dentists participating in these programs, percentage of children in free/reduced school lunch programs, number of dental and dental hygiene programs, number of licensed dentists and dental hygienists, number of community/school/local health department-based dental clinics
- Infrastructure and administration of state dental programs: e.g., FTEs, funding
- Programs funded/conducted/facilitated by state dental programs: e.g., sealants, water fluoridation, other fluorides, injury prevention, tobacco cessation, access to care; also includes number of persons served.
ASTDD Best Practices Project. ASTDD has collected best practice submissions from states in the categories of Assessment, Policy Development, Assurance, and Oral Health Program Infrastructure. As of October 2002, 39 states had submitted 116 practice descriptions. An analysis and synthesis of the best practice submissions will result in a set of dental public health approaches that include oral health surveillance, community water fluoridation, school-based/school-linked sealant programs, statutory mandate for state oral health programs, state oral health coalition, state oral health plan, and public health efforts to improve access to care for the underserved. The submissions will be housed in a searchable database on the ASTDD Web site, and available to the public in 2003.
Oral health or dental care data can be found on the Web sites of some organizations that support research or collect data in a standardized way.
The Kaiser Family Foundation recently introduced State Health Facts On-line, which shows the number of uninsured adults and children in each state, Medicaid and SCHIP eligibility requirements, new AIDS cases, health care costs, etc. Information can be viewed for a single state and compared to US totals and to all states. Data can also be downloaded and imported into spreadsheet programs for customized comparisons.
The Urban Institute has created State Profiles of Health Insurance, Access and Use for AL, CA, CO, FL, MA, MI, MN, MS, NJ, NY, TX, WA and WI, based on the 1999 National Survey of America’s Families. The profiles provide state and national-level data in easy-to-use tables. Dental access information is reported for any dental visit, average number of visits, and unmet dental needs, displayed by employer-sponsored/other insurance, Medicaid/SCHIP/state coverage, uninsured, all children, all low-income children, all adults, and all low-income adults. These data can be compared to data from the 1997 survey. State profiles are available online at http://newfederalism.urban.org/html/statefocus.html.
Oral Health Americacollects data every year from states to publish an Oral Health Report Card.
Special Olympics, Special Smilescollects oral health information on athletes competing in special Olympic events.
Children’s Dental Health Project collects data and publishes articles and reports using national, state and local data, particularly on issues related to access to dental care. Access their Web site at www.cdhp.org/Index.asp?PA=3&XX=115&XX=153&XX=147&XX=81.