Renal Mechanisms Section
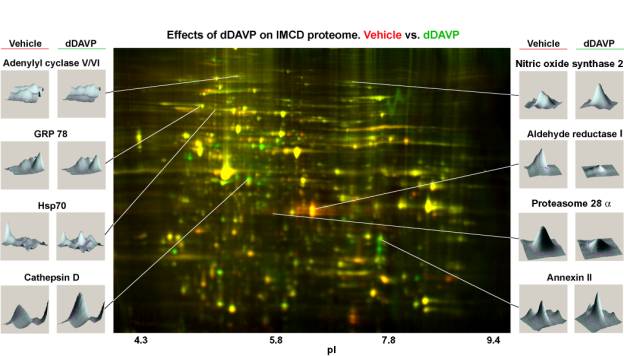
Response of IMCD proteome to long-term vasopressin treatment. The figure shows results from a DIGE experiment comparing inner medullary collecting duct proteome from Brattleboro rats treated with vehicle (Cy2-labeled, false colored red) and Brattleboro rats treated with the vasopressin analog dDAVP (Cy3-labeled, false colored green). Vehicle/control samples and dDAVP samples were mixed and run on the same two-dimensional gel prior to fluorescence imaging. Figure shows superimposed fluorescence images (center) flanked by three-dimensional representations of selected spots. Spots that appear red represent downregulated proteins after dDAVP. Spots that appear green represent proteins that upregulated after dDAVP. Proteins that are equally abundant in both samples appear yellow. Full range of horizontal axis is from 3 pH units (left) to 10 pH units (right). Full range of vertical axis is approximately 15 kDa (bottom) to 120 kDa (top). For details, see: Van Balkom BW, Hoffert JD, Chou CL, Knepper MA. Proteomic analysis of long-term vasopressin action in the inner medullary collecting duct of the Brattleboro rat . Am J Physiol 286: F216-F224, 2004.
|
|