Sample Joinpoint Regression Analysis
This example is an analysis of trends in colorectal cancer incidence rates
from 1973-2002 in the SEER cancer registries.
There are four steps involved in generating any Joinpoint trend analysis. As you review the description of each step
in this exercise, you may view or download the files that were created in the process.
Step 1: Create an Input Data File for Joinpoint
Step 2: Set Parameters in the Joinpoint Program
Step 3: Execute the Joinpoint Regression Program
Step 4: View the Joinpoint Results
Creating an Input Data File for Joinpoint
The Joinpoint input file must be an ASCII text file. Refer to the Joinpoint help system for details concerning the
format of this file. You may use SAS, SPSS or any software package to create this text file. For this example, we
used the SEER*Stat system to create the input file. SEER*Stat provides
a convenient mechanism for generating the statistics, exporting the statistics to a text file, and providing the file
format information required by Joinpoint.
The input data file for this example contains age-adjusted incidence
rates and standard errors by year of diagnosis and sex. We used the SEER*Stat software to generate these rates for
colorectal cancer in the 9 SEER registries, 1973-2002. If you have the SEER*Stat software, you may open or download
sample.sim, the SEER*Stat matrix file. Or you may view the SEER*Stat results in sample.pdf
using Adobe Acrobat. The rates and confidence intervals were exported to a text file (sample.txt)
using the SEER*Stat export feature. View the SEER*Stat export dictionary (sample.dic) for
more information regarding the contents of the sample input file.
Set Parameters in the Joinpoint Program
The Joinpoint Regression Program requires that you specify parameters that are organized on two tabs.
Specifications Tab
Use the SpecificationsTab to specify the file format of the input data file and some specifications for the model. Remember
that the input data file for this exercise was created by exporting SEER*Stat results. SEER*Stat creates two files
when exporting data: the export data file and an export dictionary. SEER*Stat export dictionary files contain information
describing the layout of the export data file. Download the following files to use in this exercise:
- Sample.dic is the SEER*Stat export dictionary to use in this exercise and
- Sample.txt is the data exported from SEER*Stat. This will be used as the Input Data File
for this exercise.
From the Joinpoint File menu, select "New Session" and then in the “Create Session from” window,
select “SEER*STAT Export Dictionary” and click “Ok”. Use the file dialog window to open the copy
of sample.dic that you downloaded. Joinpoint will use the information in the export dictionary to set the variable locations,
record format, and by-variable formats on the Input Tab. Be sure that the Input Data File is set properly. You may need
to browse to the folder in which you downloaded sample.txt. For this exercise, the default setting was used for the
Heteroscedastic Errors Option. Please refer to the Joinpoint program's online help for more information regarding this
option.
Advanced Tab
For this exercise, the default settings on the Advanced tab were used. Please refer to the Joinpoint program's online
help for more information regarding the options on this tab.
Save the settings by selecting "Save As" from the File menu. This will save the Joinpoint Session file
(i.e. sample.jps) with all the information you have loaded or set on each of the tabs above.
Execute the Joinpoint Regression Program
Click the lightning bolt on the Joinpoint toolbar or select "Session" from the File menu and then select “Execute”.
A progress meter will be shown on the screen while the Joinpoint calculation engine processes the data and generates
the output. After execution has completed, Joinpoint opens an output window to display the results.
View the Joinpoint Results
The output window displays the results on four tabs: Graph, Data, Model
Estimates, and Permutation Tests.
These results are not automatically saved. If you close the output window without saving your results, you will need
to re-run the analysis. The results can be saved to a Joinpoint output file (i.e. sample.jpo)
by selecting "Save As" from the File menu. Or, the results can be exported as text files in a variety of
formats by selecting “Output” from the File menu and then “Export as Text”. Choosing “Data”
will export the information displayed on the Data tab (i.e. the coordinates used to produce the graphs) to a text
file such as sample.data.txt. Choosing “Report” will export all the information
from the “Model Estimates” tab to a text file such as sample.report.txt.
There are a number of options to control how you would like this information to be exported. These text files can
then be imported into other software packages for creating graphs (i.e. Excel, Harvard Graphic), or producing reports
and tables (i.e. Excel, Word, WordPerfect), or for further analyses (i.e. SAS, Splus).
Sample.jps is the session file used for this example analysis. If you would like to use
sample.jps, you may need to change the location of the input data file on the Input tab.
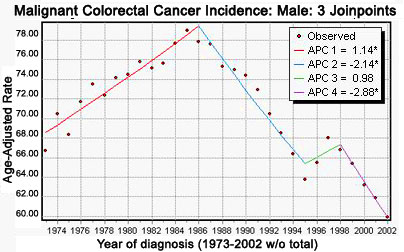
You may compare the graph created from your analysis with the graph below.
The following graph was created in Joinpoint when the file sample.dic was loaded and the
session was executed. This is a scatter plot of the age-adjusted colorectal cancer incidence from SEER, for males
from 1973 to 2002. A Joinpoint Model is also drawn on this graph. In this case, the model is four line segments joined
at the joinpoints of 1986, 1995, and 1998. The model increases until 1986 then decreases until 1995 increases again
until 1998 and then finally decreases.
|