
 |
|
 |
![]()

|
Physician Office Visit Data
The following figures
were excerpted from:
Cherry DK, Woodwell
DA, Rechtsteiner EA. National Ambulatory Medical Care Survey: 2005 Summary. Advance
data from
vital and health
statistics; no.
387. Hyattsville, Maryland: National Center for Health Statistics.
2007.
![]()
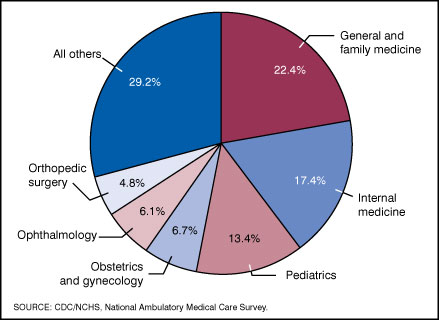
Figure 1. Percent distribution of office visits by
physician specialty: United States, 2005
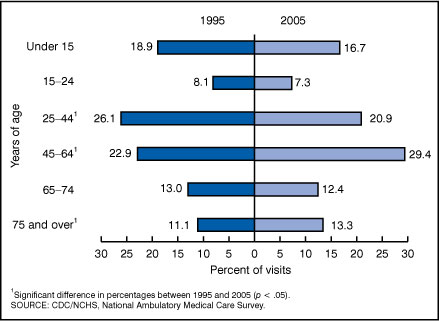
Figure 2.
Percent distribution of office visits by patient age,
according to year: United States, 1995 and 2005
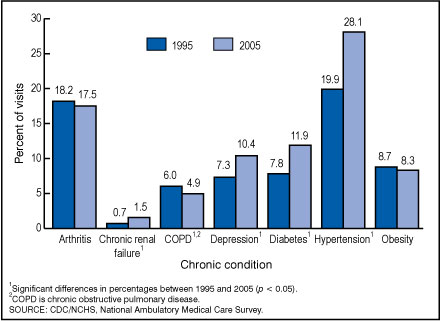
Figure 3. Percentage of office visits by adults 18
years and over with selected chronic conditions: United States, 1995 and
2005
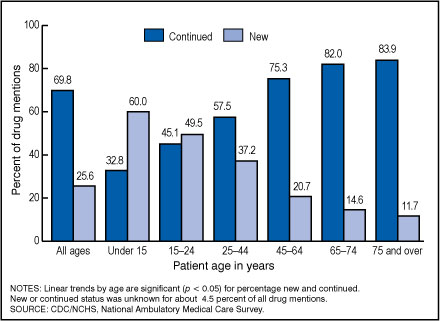
Figure 4.
Percentage of drugs mentioned at office visits that were new or continued,
by patient age: United States, 2005
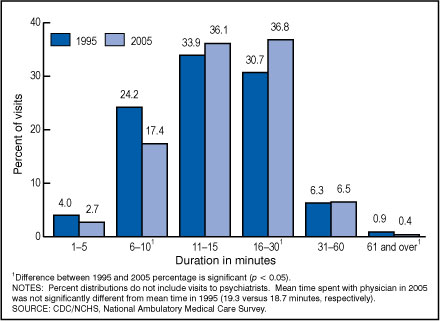
Figure 5.
Percent distribution of office visits where a physician
was seen by duration of visit, according to year: United States, 1995
and 2005
NAMCS/NHAMCS Home | NAMCS
Participants |
This page last reviewed
October 15, 2008
|
