Skip Navigation LinksSkip Navigation Links
Centers for Disease Control and Prevention

CDC Home Search Health Topics A-Z
MMWR

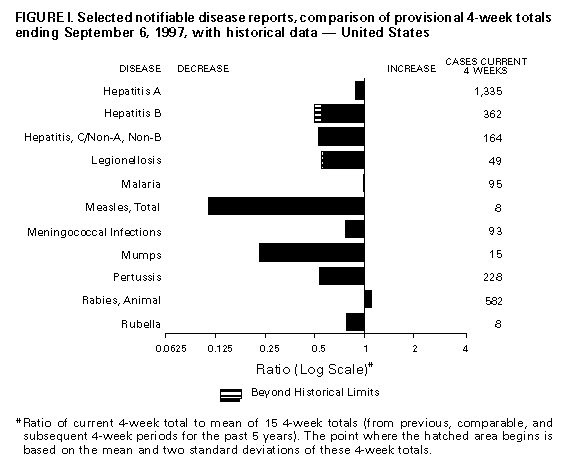
Notifiable Diseases/Deaths in Selected Cities Weekly Information

Figure_I Selected notifiable disease reports, comparison of provisional 4-week totals ending September 6, 1997, with historical data -- United States

Table_I Summary -- provisional cases of selected notifiable diseases, United States, cumulative, week ending September 6, 1997 (36th Week)

Table_II Provisional cases of selected notifiable diseases, United States, weeks ending September 6, 1997 and September 7, 1996 (36th Week)

Table_III Provisional cases of selected notifiable diseases preventable by vaccination, United States, weeks ending September 6, 1997 and September 7, 1996 (36th Week)

Table_IV Deaths in 122 U.S. cities, week ending September 6, 1997 (36th Week)
Figure_I

Figure_I
Return to top.

Table_I
Note: To print large tables and graphs users may have to change their printer settings to landscape and use a small font size.


TABLE I. Summary -- provisional cases of specified notifiable diseases, United
States, cumulative, week ending September 6, 1997 (36th Week)
==================================================================================
                                             Cum. 1997
------------------------------------------------------
Anthrax                                              -
Brucellosis                                         48
Cholera                                             10
Congenital rubella syndrome                          3
Cryptosporidiosis*                               1,040
Diphtheria                                           5
Encephalitis:  California*                          47
               eastern equine*                       2
               St. Louis*                            2
               western equine*                       1
Hansen Disease                                      70
Hantavirus pulmonary syndrome*+                     15
Hemolytic uremic syndrome, post-diarrheal*          35
HIV infection, pediatric*&                         173
Plague                                               2
Poliomyelitis, paralytic                             -
Psittacosis                                         36
Rabies, human                                        2
Rocky Mountain spotted fever (RMSF)                267
Streptococcal disease, invasive Group A          1,045
Streptococcal toxic-shock syndrome*                 26
Syphilis, congenital@                              196
Tetanus                                             29
Toxic-shock syndrome                                84
Trichinosis                                          6
Typhoid fever                                      214
Yellow fever                                         -
------------------------------------------------------
-: no reported cases
 * Not notifiable in all states
 + Updated weekly from reports to the Division of Viral and Rickettsial
   Diseases, National Center for Infectious Diseases (NCID).
 & Updated monthly to the Division of HIV/AIDS Prevention, National Center
   for HIV, STD, and TB Prevention (NCHSTP), last update August 26, 1997.
 @ Updated quarterly from reports to the Division of STD Prevention,
   NCHSTP.

==================================================================================

Return to top.

Table_II
Note: To print large tables and graphs users may have to change their printer settings to landscape and use a small font size.

TABLE II. (page 1) Provisional cases of selected notifiable diseases, United States, weeks ending
September 6, 1997, and September 7, 1996 (36th Week)

                                                                  Escherichia
                                                                 coli O157:H7
                                                              -------------------                                Hepatitis
                          AIDS*             Chlamydia          NETSS**   PHLIS***         Gonorrhea               C\NA,NB
                   -----------------   --------------------   --------   --------    -------------------      ----------------
                     Cum.       Cum.        Cum.       Cum.       Cum.       Cum.        Cum.       Cum.       Cum.       Cum.
Reporting Area       1997       1996        1997       1996       1997       1997        1997       1996       1997       1996
------------------------------------------------------------------------------------------------------------------------------
UNITED STATES      39,488     45,513     298,835    295,131      1,471        848     187,335    216,238      2,133      2,401

NEW ENGLAND         1,740      1,966      11,729     11,697        129         66       3,962      4,434         46         69
Maine                  42         31         658        635         11          -          38         38          -          -
N.H.                   26         58         510        500          6          7          67        110          8          7
Vt.                    30         14         274        272          6          1          36         41          2         17
Mass.                 604        995       4,851      4,565         74         55       1,480      1,475         29         39
R.I.                  113        123       1,339      1,354          4          -         306        357          7          6
Conn.                 925        745       4,097      4,371         28          3       2,035      2,413          -          -

MID. ATLANTIC      12,364     12,704      40,760     43,259         90         22      24,658     28,476        239        193
Upstate N.Y.        1,935      1,671           N          N         60          -       3,905      5,073        178        153
N.Y. City           6,469      7,052      21,267     22,351          8          -       9,519     10,397          -          3
N.J.                2,526      2,392       6,239      8,446         22         16       4,886      5,934          -          -
Pa.                 1,434      1,589      13,254     12,462          N          6       6,348      7,072         61         37

E.N. CENTRAL        2,905      3,608      39,843     58,895        276        147      25,166     39,663        383        341
Ohio                  626        810       7,398     14,247         66         32       5,132     10,119         13         24
Ind.                  411        459       6,158      6,483         49          -       4,053      4,212         10          7
Ill.                1,186      1,576       7,327     16,684         47          -       3,568     11,813         61         67
Mich.                 499        566      12,692     14,129        114         82       9,644     10,180        299        243
Wis.                  183        197       6,268      7,352          N         33       2,769      3,339          -          -

W.N. CENTRAL          729      1,047      16,004     21,717        330        221       7,417     10,437        113         66
Minn.                 138        188           U      3,560        155        135           U      1,610          3          1
Iowa                   79         69       2,857      2,717         76         28         758        680         22         30
Mo.                   318        537       7,955      8,775         34         44       4,948      5,878         73         17
N. Dak.                11         11         546        650          9          6          37         23          2          -
S. Dak.                 7          9         865      1,004         19          -          94        124          -          -
Nebr.                  72         74       1,147      1,929         23          -         426        712          2          6
Kans.                 104        159       2,634      3,082         14          8       1,154      1,410         11         12

S. ATLANTIC         9,404     11,155      62,789     33,832        143         92      61,358     63,953        197        132
Del.                  175        212       1,276      1,148          3          4         819      1,007          -          -
Md.                 1,167      1,320       4,869          U         13          6       9,012      7,355         11          2
D.C.                  657        803           N          N          2          -       3,004      3,099          -          -
Va.                   769        793       7,868      7,521          N         18       5,215      6,411         20         10
W. Va.                 79         83       2,028      1,485          N          1         638        519         13          9
N.C.                  598        605      12,590          U         43         29      12,258     12,727         38         34
S.C.                  545        583       8,578          U          7          7       8,071      7,747         30         21
Ga.                 1,156      1,641       9,239      7,947         34          -      10,513     13,144          U          -
Fla.                4,258      5,115      16,341     15,731         40         27      11,828     11,944         85         56

E.S. CENTRAL        1,370      1,558      22,779     20,811         72         30      22,776     22,097        245        415
Ky.                   234        269       4,350      4,626         21          -       2,769      2,860         11         26
Tenn.                 576        578       8,723      9,040         37         30       7,453      7,840        173        310
Ala.                  333        431       5,750      5,781         11          -       8,057      9,246          7          3
Miss.                 227        280       3,956      1,364          3          -       4,497      2,151         54         76

W.S. CENTRAL        4,187      4,568      40,057     38,043         45          8      25,532     26,411        293        249
Ark.                  160        185         905      1,227          9          1       1,893      2,902          1          8
La.                   716      1,077       6,404      4,962          6          3       6,047      5,187        145        141
Okla.                 215        187       5,167      5,324          3          1       3,408      3,373          7          1
Tex.                3,096      3,119      27,581     26,530         27          3      14,184     14,949        140         99

MOUNTAIN            1,114      1,340      16,420     17,241        172         90       5,508      5,344        295        420
Mont.                  33         23         697        849         21          -          31         24         15         11
Idaho                  37         28         993      1,073         18         13          78         78         40         92
Wyo.                   13          4         398        432         12          -          40         29        130        129
Colo.                 278        360       1,896      1,533         68         42       1,336      1,116         28         41
N. Mex.               112        116       2,238      2,633          6          4         908        535         42         61
Ariz.                 273        373       7,321      7,622          N         23       2,428      2,651         24         50
Utah                   88        124       1,116      1,033         37          -         170        200          3         18
Nev.                  280        312       1,761      2,066         10          8         517        711         13         18

PACIFIC             5,675      7,566      48,454     49,636        214        165      10,958     15,423        322        516
Wash.                 457        507       6,150      6,688         53         54       1,298      1,448         19         41
Oreg.                 222        338       3,328      3,811         56         63         504        588          3          6
Calif.              4,918      6,564      36,915     37,124         94         41       8,585     12,773        196        321
Alaska                 36         23       1,017        813         11          1         259        300          -          2
Hawaii                 42        134       1,044      1,200          N          6         312        314        104        146

Guam                    2          4          31        267          N          -           3         46          -          6
P.R.                1,382      1,511           U          U         30          U         418        456         87        126
V.I.                   75         17           N          N          N          U           -          -          -          -
Amer. Samoa             -          -           -          -          N          U           -          -          -          -
C.N.M.I.                1          -           N          N          N          U          17         11          2          -
------------------------------------------------------------------------------------------------------------------------------
N: Not notifiable    U: Unavailable    -: no reported cases    C.N.M.I.: Commonwealth of North Mariana Islands

  * Updated monthly to the Division of HIV/AIDS Prevention, National Center for HIV, STD, and TB Prevention, last update August 26, 1997.
 ** National Electronic Telecommunications System for Surveillance.
*** Public Health Laboratory Information System.

=======================================================================================================================================================

TABLE II. (page 2) Provisional cases of selected notifiable diseases, United States, weeks ending
September 6, 1997, and September 7, 1996 (36th Week)

                                                 Lyme                                     Syphilis                                  Rabies,
                     Legionellosis              Disease              Malaria        (Primary & Secondary)      Tuberculosis         Animal
                    ----------------       ----------------      ----------------   ---------------------    -----------------      -------
                     Cum.       Cum.        Cum.       Cum.       Cum.       Cum.        Cum.       Cum.       Cum.       Cum.        Cum.
Reporting Area       1997       1996        1997       1996       1997       1996        1997       1996       1997       1996        1997
-------------------------------------------------------------------------------------------------------------------------------------------
UNITED STATES         580        614       5,121      9,595      1,136      1,057       5,533      8,163     11,705     12,972       5,260

NEW ENGLAND            45         34       1,236      2,850         65         40         102        114        297        291         808
Maine                   2          2           8         25          1          7           -          -         11         17         143
N.H.                    5          1          19         35          7          1           -          1         10          9          28
Vt.                    10          4           6         19          2          2           -          -          4          1          95
Mass.                  10         18         207        142         24         14          47         54        166        141         169
R.I.                    5          9         220        331          5          6           2          1         26         24          23
Conn.                  13          N         776      2,298         26         10          53         58         80         99         350

MID. ATLANTIC         105        152       3,043      5,601        272        320         263        341      2,159      2,394       1,067
Upstate N.Y.           28         50       1,285      2,669         47         56          22         52        293        280         809
N.Y. City               4         10          30        279        141        194          63        100      1,124      1,245           U
N.J.                   15          9         743      1,260         65         50         101        119        440        498         114
Pa.                    58         83         985      1,393         19         20          77         70        302        371         144

E.N. CENTRAL          175        193          59        338         98        132         446      1,233      1,120      1,400         116
Ohio                   81         64          39         19         15          9         133        466        203        201          77
Ind.                   30         38          17         19         12         12         103        156        100        119          10
Ill.                    7         28           3          8         31         67          44        344        545        759          12
Mich.                  49         32           -          6         30         30          93        133        186        250          17
Wis.                    8         31           U        286         10         14          73        134         86         71           -

W.N. CENTRAL           45         32          82        120         41         33         109        250        373        337         346
Minn.                   1          3          56         38         19         15           U         31         99         77          37
Iowa                   11          8           5         15          9          2           6         15         43         44         121
Mo.                    13          5          15         36          6          9          76        175        153        141          16
N. Dak.                 2          -           -          -          2          1           -          -          8          6          55
S. Dak.                 2          2           1          -          -          -           -          -          9         15          51
Nebr.                  12         11           2          2          1          2           5         10         14         14           1
Kans.                   4          3           3         29          4          4          22         19         47         40          65

S. ATLANTIC            86         80         447        465        239        182       2,291      2,625      2,252      2,417       2,162
Del.                    8          9          31        150          4          3          17         26         18         30          47
Md.                    17         17         306        193         67         55         636        473        221        200         389
D.C.                    3          7           7          3         12          7          82         96         73         93           4
Va.                    17         13          37         33         51         32         169        300        194        201         443
W. Va.                  N          N           3         11          -          3           3          2         41         44          66
N.C.                   11          7          24         58         12         19         514        715        302        326         649
S.C.                    3          4           2          4         11          9         269        276        214        255         135
Ga.                     -          3           1          1         25         16         377        472        422        440         221
Fla.                   27         20          36         12         57         38         224        265        767        828         208

E.S. CENTRAL           35         35          53         60         23         27       1,242      1,773        879        957         216
Ky.                     5          3           7         21          4          7         100         97        120        161          23
Tenn.                  24         17          29         17          6         11         543        586        304        325         130
Ala.                    2          3           5          6         10          3         323        393        299        300          63
Miss.                   4         12          12         16          3          6         276        697        156        171           -

W.S. CENTRAL           13         17          56         83         15         24         789      1,300      1,622      1,455         230
Ark.                    -          1          15         20          4          -          71        184        134        132          27
La.                     2          1           2          1          8          4         256        372        152         11           2
Okla.                   3          5          12         13          3          -          85        137        125        116          77
Tex.                    8         10          27         49          -         20         377        607      1,211      1,196         124

MOUNTAIN               40         32          13          6         58         42         117        105        335        422         114
Mont.                   1          1           -          -          2          6           -          -          7         14          33
Idaho                   2          -           2          -          -          -           -          4          8          6           -
Wyo.                    1          3           3          3          2          3           -          2          2          5          26
Colo.                  14          7           4          -         26         17           9         24         61         54           -
N. Mex.                 2          1           1          1          8          2           8          4         18         58           9
Ariz.                   9         13           1          -          8          6          86         57        169        166          39
Utah                    7          2           -          1          3          4           5          2         24         39           3
Nev.                    4          5           2          1          9          4           9         12         46         80           4

PACIFIC                36         39         132         72        325        257         174        422      2,668      3,299         201
Wash.                   6          5           6         12         17         15           8          8        211        186           -
Oreg.                   -          -          15         14         16         16           5          6        114        124          12
Calif.                 29         30         111         45        287        216         159        406      2,166      2,804         167
Alaska                  -          1           -          -          3          3           1          -         57         56          22
Hawaii                  1          3           -          1          2          7           1          2        120        129           -

Guam                    -          1           -          -          -          -           -          3          5         55           -
P.R.                    -          -           -          -          5          1         173        159        129        130          50
V.I.                    -          -           -          -          -          -           -          -          -          -           -
Amer. Samoa             -          -           -          -          -          -           -          -          -          -           -
C.N.M.I.                -          -           -          -          -          -           9          1          2          -           -

-------------------------------------------------------------------------------------------------------------------------------------------
N: Not notifiable    U: Unavailable    -: no reported cases

=======================================================================================================================================================

Return to top.

Table_III
Note: To print large tables and graphs users may have to change their printer settings to landscape and use a small font size.

TABLE III. (page 1) Provisional cases of selected notifiable diseases preventable by vaccination, United
States, weeks ending September 6, 1997, and September 7, 1996 (36th Week)

                                                Hepatitis (Viral), by type                                    Measles (Rubeola)
                     H. influenzae,       ---------------------------------------        ------------------------------------------------------------
                        invasive                  A                     B                  Indigenous            Imported**                Total
                    ----------------      -----------------     -----------------        ---------------       ---------------        ---------------
                     Cum.       Cum.        Cum.       Cum.       Cum.       Cum.                   Cum.                  Cum.        Cum.       Cum.
Reporting Area       1997*      1996        1997       1996       1997       1996        1997       1997       1997       1997        1997       1996
-----------------------------------------------------------------------------------------------------------------------------------------------------
UNITED STATES         743        760      18,644     18,741      5,847      6,584           1         59          2         45         104        434

NEW ENGLAND            42         26         443        252        102        149           -         11          -          6          17         15
Maine                   4          -          47         14          6          2           -          -          -          1           1          -
N.H.                    5         10          22         10          9          9           -          1          -          -           1          -
Vt.                     3          1           9          6          5         11           -          -          -          -           -          2
Mass.                  26         13         170        129         38         52           -         10          -          4          14         12
R.I.                    2          2         107         13         12          9           -          -          -          -           -          -
Conn.                   2          -          88         80         32         66           -          -          -          1           1          1

MID. ATLANTIC          91        158       1,300      1,293        857      1,003           -         14          -          8          22         35
Upstate N.Y.           21         40         211        300        187        238           -          2          -          3           5          9
N.Y. City              24         42         482        391        310        360           -          5          -          2           7         11
N.J.                   36         40         193        255        155        194           -          2          -          -           2          3
Pa.                    10         36         414        347        205        211           -          5          -          3           8         12

E.N. CENTRAL          121        129       1,794      1,760        626        763           -          6          -          3           9         17
Ohio                   71         74         238        570         59         91           -          -          -          -           -          2
Ind.                   13          7         209        227         72        100           -          -          -          -           -          -
Ill.                   26         35         419        503        157        239           -          6          -          1           7          3
Mich.                  10          8         828        304        306        266           -          -          -          2           2          3
Wis.                    1          5         100        156         32         67           -          -          -          -           -          9

W.N. CENTRAL           41         34       1,482      1,591        318        341           1         10          -          3          13         22
Minn.                  27         21         132         90         28         40           1          1          -          3           4         18
Iowa                    6          3         319        252         29         47           -          -          -          -           -          -
Mo.                     4          7         735        798        225        200           -          1          -          -           1          3
N. Dak.                 -          -          10         75          3          2           -          -          -          -           -          -
S. Dak.                 2          1          18         41          1          3           -          8          -          -           8          -
Nebr.                   1          1          70        105         10         25           U          -          U          -           -          -
Kans.                   1          1         198        230         22         24           -          -          -          -           -          1

S. ATLANTIC           127        140       1,235        801        884        897           -          1          1         10          11         11
Del.                    -          2          24         11          4          6           -          -          -          -           -          1
Md.                    46         49         168        136        120        119           -          -          -          2           2          2
D.C.                    -          5          17         22         25         27           -          -          -          1           1          -
Va.                    11          6         151        115         86         98           -          -          -          1           1          3
W. Va.                  3          7           8         13         11         18           -          -          -          -           -          -
N.C.                   17         22         138        101        180        254           -          -          1          2           2          2
S.C.                    4          4          76         42         77         61           -          -          -          1           1          -
Ga.                    24         31         266         86         94          8           -          -          -          1           1          2
Fla.                   22         14         387        275        287        306           -          1          -          2           3          1

E.S. CENTRAL           37         23         440        982        474        583           -          -          -          -           -          2
Ky.                     5          5          58         31         26         52           -          -          -          -           -          -
Tenn.                  24          9         275        648        322        330           -          -          -          -           -          2
Ala.                    8          8          66        141         49         47           -          -          -          -           -          -
Miss.                   -          1          41        162         77        154           U          -          U          -           -          -

W.S. CENTRAL           36         32       3,847      3,610        715        771           -          3          -          4           7         25
Ark.                    1          -         184        320         42         56           -          -          -          -           -          -
La.                     8          3         150        109         97         84           -          -          -          -           -          -
Okla.                  24         25       1,118      1,599         34         24           -          -          -          -           -          -
Tex.                    3          4       2,395      1,582        542        607           -          3          -          4           7         25

MOUNTAIN               76         39       3,065      3,026        638        796           -          7          1          2           9        156
Mont.                   -          -          59         82          7          8           -          -          -          -           -          -
Idaho                   1          1          98        154         25         70           -          -          -          -           -          1
Wyo.                    3          -          28         26         29         33           -          -          -          -           -          1
Colo.                  12         11         309        319        119         95           -          -          -          -           -          7
N. Mex.                 8          9         234        289        195        282           -          1          -          -           1         16
Ariz.                  29         12       1,588      1,203        145        182           -          5          -          -           5          8
Utah                    3          6         439        667         71         68           -          -          1          1           1        118
Nev.                   20          -         310        286         47         58           -          1          -          1           2          5

PACIFIC               172        179       5,038      5,426      1,233      1,281           -          7          -          9          16        151
Wash.                   3          2         366        334         49         64           -          1          -          1           2         38
Oreg.                  30         24         260        639         76         80           -          -          -          -           -         12
Calif.                128        146       4,300      4,363      1,083      1,121           -          4          -          7          11         34
Alaska                  4          5          25         33         17          8           -          -          -          -           -         63
Hawaii                  7          2          87         57          8          8           -          2          -          1           3          4

Guam                    -          -           -          6          1          -           U          -          U          -           -          -
P.R.                    -          1         219        159      1,045        686           -          -          -          -           -          2
V.I.                    -          -           -         29          -         26           U          -          U          -           -          -
Amer. Samoa             -          -           -          -          -          -           U          -          U          -           -          -
C.N.M.I.                6         10           1          1         34          5           U          1          U          -           1          -
-----------------------------------------------------------------------------------------------------------------------------------------------------
N: Not notifiable    U: Unavailable     -: no reported cases

 * Of 165 cases among children aged <5 years, serotype was reported for 87 and of those, 35 were type b.
** For imported measles, cases include only those resulting from importation from other countries.
=======================================================================================================================================================

TABLE III. (page 2) Provisional cases of selected notifiable diseases preventable by vaccination, United
States, weeks ending September 6, 1997, and September 7, 1996 (36th Week)

                     Meningococcal
                        Disease                      Mumps                           Pertussis                          Rubella
                   -----------------        --------------------------       ---------------------------       ---------------------------
                     Cum.       Cum.                   Cum.       Cum.                   Cum.       Cum.                  Cum.        Cum.
Reporting Area       1997       1996        1997       1997       1996       1997        1997       1996       1997       1997        1996
------------------------------------------------------------------------------------------------------------------------------------------
UNITED STATES       2,340      2,287           4        391        493         64       3,439      3,616          4        135         213

NEW ENGLAND           148         95           -          8          1          -         636        811          -          1          25
Maine                  17         10           -          -          -          -           6         27          -          -           -
N.H.                   13          3           -          -          -          -          80         72          -          -           -
Vt.                     4          3           -          -          -          -         187         55          -          -           2
Mass.                  72         37           -          2          1          -         337        611          -          1          20
R.I.                   14         10           -          5          -          -          12         25          -          -           -
Conn.                  28         32           -          1          -          -          14         21          -          -           3

MID. ATLANTIC         214        246           -         41         59          -         243        252          -         29          10
Upstate N.Y.           54         64           -          7         18          -          82        127          -          2           4
N.Y. City              39         37           -          3         14          -          56         22          -         27           4
N.J.                   46         53           -          5          2          -           9         17          -          -           2
Pa.                    75         92           -         26         25          -          96         86          -          -           -

E.N. CENTRAL          327        328           1         45        101          7         288        441          -          4           3
Ohio                  129        121           1         19         35          4         109        158          -          -           -
Ind.                   36         46           -          7          6          -          38         32          -          -           -
Ill.                   97         90           -          9         19          3          51         98          -          1           1
Mich.                  39         33           -         10         39          -          38         29          -          -           2
Wis.                   26         38           -          -          2          -          52        124          -          3           -

W.N. CENTRAL          174        188           -         13         14         23         253        211          -          -           -
Minn.                  29         25           -          5          5         18         160        156          -          -           -
Iowa                   39         40           -          6          1          1          25         10          -          -           -
Mo.                    77         71           -          -          5          3          43         25          -          -           -
N. Dak.                 2          3           -          -          2          -           2          1          -          -           -
S. Dak.                 4         10           -          -          -          1           4          4          -          -           -
Nebr.                   8         17           U          2          -          U           6          5          U          -           -
Kans.                  15         22           -          -          1          -          13         10          -          -           -

S. ATLANTIC           414        356           3         55         80         13         335        366          4         69          91
Del.                    5          2           -          -          -          -           1         17          -          -           -
Md.                    37         40           -          4         27          1          99        132          2          3           -
D.C.                    -          5           -          -          -          -           3          -          -          -           1
Va.                    38         42           -          9         12          -          34         44          -          1           2
W. Va.                 14         13           -          -          -          -           6          2          -          -           -
N.C.                   77         60           1          9         17          4          89         72          1         52          77
S.C.                   44         42           -         10          5          1          21         21          -          9           1
Ga.                    77        106           -          5          2          -           9         17          -          1           -
Fla.                  122         46           2         18         17          7          73         61          1          3          10

E.S. CENTRAL          186        162           -         18         19          2          78        172          -          -           2
Ky.                    38         21           -          3          -          -          21        134          -          -           -
Tenn.                  71         47           -          3          1          2          30         15          -          -           -
Ala.                   60         55           -          6          3          -          19         16          -          -           2
Miss.                  17         39           U          6         15          U           8          7          U          -           N

W.S. CENTRAL          223        256           -         34         36          3         148         97          -          4           8
Ark.                   27         28           -          1          1          1          22          4          -          -           -
La.                    46         47           -         11         12          2          15          7          -          -           1
Okla.                  26         26           -          -          -          -          21          8          -          -           -
Tex.                  124        155           -         22         23          -          90         78          -          4           7

MOUNTAIN              139        136           -         51         20          2         881        328          -          5           6
Mont.                   8          6           -          -          -          -          16         18          -          -           -
Idaho                   8         20           -          2          -          -         547         96          -          1           2
Wyo.                    2          3           -          1          -          -           6          4          -          -           -
Colo.                  36         28           -          3          3          1         188        104          -          -           2
N. Mex.                23         21           N          N          N          -          66         43          -          -           -
Ariz.                  39         30           -         31          1          -          30         24          -          4           1
Utah                   11         12           -          7          3          1          14         10          -          -           -
Nev.                   12         16           -          7         13          -          14         29          -          -           1

PACIFIC               515        520           -        126        163         14         577        938          -         23          68
Wash.                  62         74           -         14         18         14         259        406          -          5          15
Oreg.                 100         93           N          N          N          -          17         46          -          -           1
Calif.                346        344           -         92        120          -         276        459          -         10          49
Alaska                  2          6           -          3          2          -          14          2          -          -           -
Hawaii                  5          3           -         17         23          -          11         25          -          8           3

Guam                    -          4           U          1          4          U           -          -          U          -           -
P.R.                    9         11           2          7          1          -           -          2          -          -           -
V.I.                    -          -           U          -          1          U           -          -          U          -           -
Amer. Samoa             -          -           U          -          -          U           -          -          U          -           -
C.N.M.I.                -          -           U          4          -          U           -          -          U          -           -

------------------------------------------------------------------------------------------------------------------------------------------
N: Not notifiable    U: Unavailable     -: no reported cases

=======================================================================================================================================================

Return to top.

Table_IV
Note: To print large tables and graphs users may have to change their printer settings to landscape and use a small font size.

TABLE IV. Deaths in 122 U.S. cities,* week ending
September 6, 1997 (36th Week)
===================================================================================================================================
                                                 All Causes, By Age (Years)
                          ------------------------------------------------------------------------        P&I**
Reporting Area            All Ages         >=65        45-64       25-44         1-24           <1        Total
---------------------------------------------------------------------------------------------------------------
NEW ENGLAND                    518          365           82          41           10           20           24
Boston, Mass.                  139           88           26          12            4            9            6
Bridgeport, Conn.               30           23            5           2            -            -            1
Cambridge, Mass.                14           13            -           -            -            1            2
Fall River, Mass.               16           14            2           -            -            -            -
Hartford, Conn.                 46           28           11           4            1            2            -
Lowell, Mass.                   19           16            1           -            -            2            1
Lynn, Mass.                      9            6            2           1            -            -            1
New Bedford, Mass.              20           17            3           -            -            -            1
New Haven, Conn.                36           21            9           3            -            3            6
Providence, R.I.                68           52            5           6            3            2            1
Somerville, Mass.                5            5            -           -            -            -            -
Springfield, Mass.              44           32            5           5            1            1            4
Waterbury, Conn.                21           15            4           2            -            -            1
Worcester, Mass.                51           35            9           6            1            -            -

MID. ATLANTIC                2,045        1,399          386         193           40           27           93
Albany, N.Y.                    45           36            3           3            3            -            2
Allentown, Pa.                  25           15            9           1            -            -            -
Buffalo, N.Y.                    U            U            U           U            U            U            U
Camden, N.J.                    30           15           11           2            2            -            4
Elizabeth, N.J.                 22           17            4           1            -            -            -
Erie, Pa.                       29           21            5           3            -            -            3
Jersey City, N.J.               38           20            8           9            -            1            3
New York City, N.Y.          1,021          708          188          98           16           11           41
Newark, N.J.                    62           31           15          15            -            1            2
Paterson, N.J.                  15           12            3           -            -            -            1
Philadelphia, Pa.              400          246           87          46           13            8           10
Pittsburgh, Pa.***              55           41            9           3            -            2            2
Reading, Pa.                    23           17            5           1            -            -            -
Rochester, N.Y.                119           83           23           5            6            2           11
Schenectady, N.Y.               19           16            2           1            -            -            2
Scranton, Pa.                   26           24            2           -            -            -            -
Syracuse, N.Y.                  57           46            6           3            -            2            8
Trenton, N.J.                   11            8            1           2            -            -            1
Utica, N.Y.                     27           24            3           -            -            -            1
Yonkers, N.Y.                   21           19            2           -            -            -            2

E.N. CENTRAL                 1,770        1,170          369         155           28           48           83
Akron, Ohio                     35           22            9           3            -            1            -
Canton, Ohio                    24           19            4           1            -            -            3
Chicago, Ill.                  429          250           97          58           15            9           11
Cincinnati, Ohio               107           73           26           5            1            2            4
Cleveland, Ohio                124           71           40           9            1            3            3
Columbus, Ohio                 121           83           25          10            -            3            7
Dayton, Ohio                   101           69           25           3            3            1            6
Detroit, Mich.                 154          103           31          16            1            3           10
Evansville, Ind.                38           28            4           4            1            1            1
Fort Wayne, Ind.                40           30            7           3            -            -            4
Gary, Ind.                       7            3            1           1            -            2            -
Grand Rapids, Mich.             75           49            9           6            -           11           11
Indianapolis, Ind.             138           93           28           9            2            6            8
Lansing, Mich.                  38           27            8           3            -            -            2
Milwaukee, Wis.                102           78           15           8            1            -            3
Peoria, Ill.                    26           21            3           -            1            1            3
Rockford, Ill.                  43           31            9           2            -            1            -
South Bend, Ind.                46           34            7           3            -            2            4
Toledo, Ohio                    81           57           15           6            2            1            1
Youngstown, Ohio                41           29            6           5            -            1            2

W.N. CENTRAL                   541          380          106          24           11           13           27
Des Moines, Iowa                 U            U            U           U            U            U            U
Duluth, Minn.                    U            U            U           U            U            U            U
Kansas City, Kans.              25           19            3           -            -            3            -
Kansas City, Mo.                89           50           19           7            2            4            3
Lincoln, Nebr.                  21           14            5           1            1            -            1
Minneapolis, Minn.             120           86           24           7            2            1            5
Omaha, Nebr.                    71           53           15           1            1            1            3
St. Louis, Mo.                  96           68           20           4            3            1            9
St. Paul, Minn.                 50           43            5           1            1            -            4
Wichita, Kans.                  69           47           15           3            1            3            2

S. ATLANTIC                  1,050          668          222         120           24           14           40
Atlanta, Ga.                   127           82           28          11            2            4            1
Baltimore, Md.                 128           75           32          19            1            1            6
Charlotte, N.C.                 84           50           20          10            4            -            3
Jacksonville, Fla.             113           74           23          10            1            5            2
Miami, Fla.                    108           70           24           8            5            1            1
Norfolk, Va.                    47           32           10           4            1            -            4
Richmond, Va.                   57           41           10           6            -            -            2
Savannah, Ga.                   62           45           10           5            2            -            4
St. Petersburg, Fla.            37           28            6           2            1            -            2
Tampa, Fla.                    137           89           29          14            2            3           13
Washington, D.C.               129           74           25          25            5            -            2
Wilmington, Del.                21            8            5           6            -            -            -

E.S. CENTRAL                   748          498          152          62           27            8           33
Birmingham, Ala.               137           89           31           8            6            2            7
Chattanooga, Tenn.              65           38           16           8            3            -            1
Knoxville, Tenn.                84           60           17           4            3            -            3
Lexington, Ky.                  73           44           16           7            4            2            8
Memphis, Tenn.                 155          107           28          15            3            2            9
Mobile, Ala.                    49           35            6           5            2            1            -
Montgomery, Ala.                54           43            7           2            1            1            4
Nashville, Tenn.               131           82           31          13            5            -            1

W.S. CENTRAL                 1,120          682          238         111           50           39           61
Austin, Tex.                    59           44           13           -            2            -            2
Baton Rouge, La.                30           16            6           4            2            2            2
Corpus Christi, Tex.            42           24            9           4            2            3            1
Dallas, Tex.                   148           67           24          34           20            3            2
El Paso, Tex.                   48           27           16           -            1            4            2
Ft. Worth, Tex.                 85           58           14           8            4            1            5
Houston, Tex.                  276          167           70          31            5            3           22
Little Rock, Ark.               54           33           10           7            1            3            3
New Orleans, La.                93           51           14          10            6           12            -
San Antonio, Tex.              170          113           37          10            5            5           12
Shreveport, La.                 49           30           16           2            1            -            6
Tulsa, Okla.                    66           52            9           1            1            3            4

MOUNTAIN                       730          486          119          74           31           19           30
Albuquerque, N.M.               89           58           14          12            4            1            3
Boise, Idaho                    39           25            6           5            3            -            1
Colo. Springs, Colo.            68           50            9           5            3            1            2
Denver, Colo.                   75           39           14          10            5            7            5
Las Vegas, Nev.                147          104           29          10            2            2           10
Ogden, Utah                     22           17            3           1            1            -            1
Phoenix, Ariz.                 115           65           19          19            9            2            3
Pueblo, Colo.                   22           14            5           1            -            2            1
Salt Lake City, Utah            78           56            9           8            2            3            1
Tucson, Ariz.                   75           58           11           3            2            1            3

PACIFIC                      1,542        1,073          268         134           38           29          104
Berkeley, Calif.                18           14            2           2            -            -            1
Fresno, Calif.                  57           42            7           6            -            2            2
Glendale, Calif.                32           26            4           1            1            -            2
Honolulu, Hawaii                71           53           10           5            2            1            3
Long Beach, Calif.              54           38            8           4            3            1            4
Los Angeles, Calif.            455          325           81          32           10            7           22
Pasadena, Calif.                33           24            5           2            2            -            4
Portland, Oreg.                 95           58           15          14            5            3            2
Sacramento, Calif.             116           82           20           6            3            5           15
San Diego, Calif.               89           59           15          12            -            3            5
San Francisco, Calif.          121           76           27          16            2            -           18
San Jose, Calif.               150          112           25          10            2            1           11
Santa Cruz, Calif.              28           19            6           3            -            -            1
Seattle, Wash.                 101           57           24          14            3            3            5
Spokane, Wash.                  45           32            8           3            1            1            2
Tacoma, Wash.                   77           56           11           4            4            2            7

TOTAL                   10,064****        6,721        1,942         914          259          217          495

---------------------------------------------------------------------------------------------------------------
U: Unavailable    -: no reported cases

   * Mortality data in this table are voluntarily reported from 122 cities in the United States, most of which have populations
     of 100,000 or more. A death is reported by the place of its occurrence and by the week that the death certificate was
     filed. Fetal deaths are not included.
  ** Pneumonia and influenza.
 *** Because of changes in reporting methods in these 3 Pennsylvania cities, these numbers are partial counts for the current
     week. Complete counts will be available in 4 to 6 weeks.
**** Total includes unknown ages.
===================================================================================================================================

Return to top.

Disclaimer   All MMWR HTML versions of articles are electronic conversions from ASCII text into HTML. This conversion may have resulted in character translation or format errors in the HTML version. Users should not rely on this HTML document, but are referred to the electronic PDF version and/or the original MMWR paper copy for the official text, figures, and tables. An original paper copy of this issue can be obtained from the Superintendent of Documents, U.S. Government Printing Office (GPO), Washington, DC 20402-9371; telephone: (202) 512-1800. Contact GPO for current prices.

**Questions or messages regarding errors in formatting should be addressed to mmwrq@cdc.gov.

Page converted: 09/19/98

HOME  |  ABOUT MMWR  |  MMWR SEARCH  |  DOWNLOADS  |  RSSCONTACT
POLICY  |  DISCLAIMER  |  ACCESSIBILITY

Safer, Healthier People

Morbidity and Mortality Weekly Report
Centers for Disease Control and Prevention
1600 Clifton Rd, MailStop E-90, Atlanta, GA 30333, U.S.A

USA.GovDHHS

Department of Health
and Human Services

This page last reviewed 5/2/01