 |
|
|
|
|
|
|
|
|
|
|
|
|
|
|
|
|
||||
| ||||||||||
|
|
|
|
Enterovirus Surveillance --- United States, 2002--2004Enteroviruses are common viruses associated with diverse clinical syndromes, ranging from minor febrile illness to severe, potentially fatal conditions (e.g., aseptic meningitis, encephalitis, paralysis, myocarditis, and neonatal enteroviral sepsis) (1,2). A total of 68 enterovirus serotypes are recognized, including 65 nonpolio enteroviruses (1,2). Individual serotypes have different temporal patterns of circulation and can be associated with different clinical manifestations (2,3). This report describes trends in reported enterovirus infections in the United States during 2002--2004, including widespread circulation of two serotypes, echovirus 9 and echovirus 30, commonly associated with aseptic meningitis outbreaks. Monitoring circulating enteroviruses helped identify these two serotypes as primary causes of aseptic meningitis outbreaks in 2003 (4). Increased state laboratory participation and timely reporting by all laboratories to CDC would further increase the public health utility of enterovirus surveillance. Other than paralytic poliomyelitis, diseases associated with enterovirus infections are not nationally notifiable in the United States. To help public health officials recognize and control outbreaks of enteroviral disease, the National Enterovirus Surveillance System (NESS) monitors temporal and geographic trends in circulating enteroviruses in the United States. Enterovirus detections, characterized by serotype, specimen type, collection date, and basic demographic information, are reported monthly to CDC by participating laboratories. NESS is a voluntary, passive surveillance system, and the number of participating state laboratories varies from year to year. During 2002--2004, a total of 24 laboratories, including 22 public health laboratories, one private laboratory, and the CDC Enterovirus Laboratory, reported 4,123 enterovirus detections in 46 states and Puerto Rico (Figure). Twenty-one states reported results directly from state public health laboratories, whereas 25 states and Puerto Rico reported results indirectly, either through the private laboratory or the CDC Enterovirus Laboratory. Four states and the District of Columbia did not report any enterovirus detections to NESS. Seven laboratories, an increase from three during 2000--2001, used genomic sequencing for enterovirus typing; 17 laboratories used traditional antigenic methods of serotype detection (neutralization reaction or immunofluorescence assay). Enterovirus serotype was identified in 3,630 (88%) reports and was unknown for 493 (12%) reports (Table 1). The two predominant enteroviruses, echoviruses 9 and 30, accounted for more than half of all enterovirus detections in the United States during 2002--2004 (Table 2). Echovirus 9 accounted for 21.5%, 41.0%, and 18.9% of detections with known serotypes during 2002, 2003, and 2004, respectively. Echovirus 30 was uncommon in 2002 (3.3%) but accounted for 32.4% of reports with known serotypes in 2003 and 40.3% in 2004. Echovirus 7 was the most common enterovirus in 2002 (22.5% of reports with known serotypes) but rarely was reported in 2003 and 2004. Coxsackievirus B1 was the third most commonly reported enterovirus in 2002 and 2003 (10.8% and 4.6%, respectively), and coxsackievirus A9 was the third most common serotype (6.9%) in 2004. Other nonpolio enteroviruses were reported infrequently, and no polioviruses were reported (Table 2). During 2002--2004, echovirus 9 was detected in 41 states and Puerto Rico, echovirus 30 in 38 states and Puerto Rico, and echovirus 7 in 24 states. Three states (Georgia, Illinois, and New York) accounted for 528 (47.8%) of the echovirus 9 detections. The majority (536 [50.7%]) of echovirus 30 detections were from Arizona, Florida, and Texas, and more than half of echovirus 7 detections (98 [54.0%]) were from Minnesota and Texas. Cerebrospinal fluid was the most common source for enterovirus detection (2,483 [63.1%] of 3,932 reports with known specimen type), followed by respiratory specimens (562 [14.3%]) and stool or rectal-swab specimens (517 [13.1%]). The age of source patients ranged from <1 month to 95 years (median: 7 years). Children aged <1 year accounted for 953 (27.4%) of 3,481 enterovirus detections for which age of source patient was known. Consistent with the established summer-fall seasonality of enterovirus circulation (2,3), the majority of enterovirus detections (2,983 [72.5%] of 4,115 records for which month of specimen collection was known) were reported during June--October of 2002, 2003, and 2004. Reported by: State virology laboratory directors. Diagnostic Virology Laboratory, Associated Regional and Univ Pathologists Laboratories, Salt Lake City, Utah. N Khetsuriani, MD, A LaMonte, MPH, L Stockman, MPH, S Oberste, PhD, M Pallansch, PhD, B Camp, Div of Viral and Rickettsial Diseases, National Center for Infectious Diseases; M Malek, MD, EIS Officer, CDC. Editorial Note:Monitoring circulating enteroviruses is important because individual serotypes have different temporal patterns of circulation and the changes in predominant serotypes can be accompanied by large-scale outbreaks of enteroviral illnesses (3). Serotype-based enterovirus surveillance in the United States has five objectives. First, NESS data help public health practitioners determine long-term patterns of circulation for individual enteroviruses (3). Second, the data are used for interpreting trends in enteroviral diseases, such as aseptic meningitis, by associating them with circulating serotypes (5) and can be helpful for studying the association of enteroviruses with clinical manifestations (e.g., chronic diseases such as diabetes) (2). Third, the data are used to guide outbreak investigations by enabling linkage of disease clusters; diagnosis by serologic assay and clinical presentation, which varies by serotype; and timelier laboratory identification. Fourth, because susceptibility to candidate anti-enterovirus drugs varies by serotype (6), information on circulating serotypes helps guide development of new diagnostic tests and therapies. Finally, NESS monitors poliovirus detections, thereby supplementing poliovirus surveillance in the United States. The findings of this report are consistent with previous observations regarding temporal variability of predominant enterovirus serotypes (3). Although the predominant serotypes change, certain enteroviruses appear consistently among those most commonly detected each year. Of the 15 most common serotypes detected during 2002--2004, seven (echoviruses 6, 9, 11, and 30 and coxsackieviruses A9, B2, and B4) have been among the 15 most common enteroviruses detected each year since 1993 (7--9). During 2002--2004, echoviruses 9 and 30 became the predominant serotypes, whereas echoviruses 18 and 13, which prevailed in 2001 (9), were detected rarely. Echoviruses 9 and 30 usually have an epidemic pattern of circulation, with periods of high activity followed by several years of relative quiescence (3). Before 2002, echovirus 9 had not been the predominant enterovirus since 1995, when it accounted for 45.1% of reported enterovirus detections, and echovirus 30 had not been widespread since 1998, when it accounted for 45.9% of reported detections (7--9). The identification of echoviruses 9 and 30 by NESS as the two most prevalent enterovirus serotypes helped guide investigations of multiple outbreaks of aseptic meningitis in the United States in 2003, all of which were subsequently linked to these serotypes (4). The occurrence of these outbreaks was consistent with the previously noted coincidence of the high activity of echoviruses 9 and 30 (as reported to NESS) with peaks in hospitalizations for aseptic meningitis in the United States (5). Echovirus 7 was the most common serotype for the first time in 2002. Small peaks of echovirus 7 activity were observed in 1979, in the mid-1980s, and in 1997, but the serotype has been detected infrequently at other times (7--9; CDC, unpublished data, 1971--2005). Beginning in 2003, the proportion of reports with unknown serotypes decreased to <10%, compared with 18%--20% during 2000--2002. This decrease likely was associated with an increase in the number of laboratories using molecular techniques to detect enteroviruses. Enterovirus typing by genomic sequencing of the capsid viral protein 1 (VP1) gene (which correlates with enterovirus serotype) allows rapid and reliable identification of any enterovirus, including those for which the reagents used in traditional antigen-based typing methods are not readily available (10). The use of this approach has led to recent identification of several previously unknown enterovirus serotypes (1). The findings in this report are subject to at least two limitations. First, enteroviruses that commonly infect younger patients or that are associated with more severe illnesses might be overrepresented in NESS because clinical specimens from young children and more severely ill patients are submitted for testing more frequently. Second, because of the voluntary and passive nature of reporting to NESS, the decreasing number of participating laboratories (from 27 during 2000--2001 to 24 during 2002--2004), the small numbers of reports from certain states, and the absence of reports from others, these results might not be representative of enterovirus circulation in the entire United States. The geographic representation of the states reporting enterovirus detections increased from 44 states during 2000--2001 to 46 states and Puerto Rico during 2002--2004 (Figure). This trend toward increased geographic representation began in 2000, when the CDC Enterovirus Laboratory and a private laboratory, both of which receive specimens from multiple states, began reporting directly to NESS. Future enterovirus surveillance would benefit from increased laboratory participation, especially by state public health laboratories. Heightened awareness of the importance of enterovirus surveillance and knowledge about the deficiency in reporting might increase reporting by state laboratories. References
Table 1 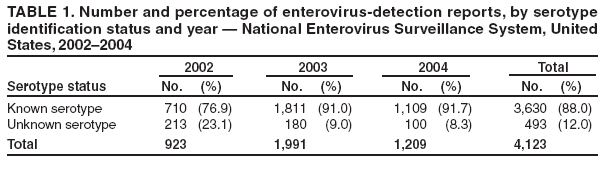 Return to top. Table 2 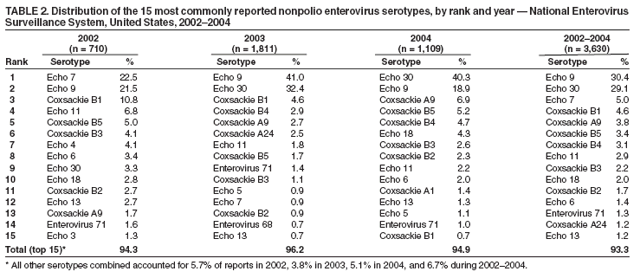 Return to top. Figure 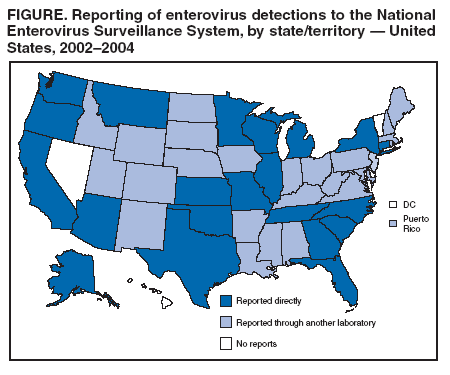 Return to top.
Disclaimer All MMWR HTML versions of articles are electronic conversions from ASCII text into HTML. This conversion may have resulted in character translation or format errors in the HTML version. Users should not rely on this HTML document, but are referred to the electronic PDF version and/or the original MMWR paper copy for the official text, figures, and tables. An original paper copy of this issue can be obtained from the Superintendent of Documents, U.S. Government Printing Office (GPO), Washington, DC 20402-9371; telephone: (202) 512-1800. Contact GPO for current prices. **Questions or messages regarding errors in formatting should be addressed to mmwrq@cdc.gov.Date last reviewed: 2/16/2006 |
|||||||||
|