Skip Navigation LinksSkip Navigation Links
Centers for Disease Control and Prevention

CDC Home Search Health Topics A-Z
MMWR

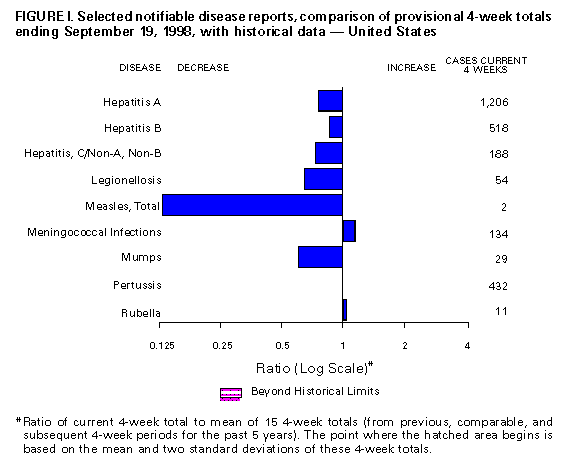
Notifiable Diseases/Deaths in Selected Cities Weekly Information

Figure_I Selected notifiable disease reports, comparison of provisional 4-week totals ending September 19, 1998, with historical data -- United States

Table_I Summary -- provisional cases of selected notifiable diseases, United States, cumulative, week ending September 19, 1998 (37th Week)

Table_II Provisional cases of selected notifiable diseases, United States, weeks ending September 19, 1998 and September 13, 1997 (37th Week)

Table_III Provisional cases of selected notifiable diseases preventable by vaccination, United States, weeks ending September 19, 1998 and September 13, 1997 (37th Week)

Table_IV Deaths in 122 U.S. cities, week ending September 19, 1998 (37th Week)
Figure_I

Figure_I
Return to top.

Table_I
Note: To print large tables and graphs users may have to change their printer settings to landscape and use a small font size.


TABLE I. Summary -- provisional cases of specified notifiable diseases, United
States, cumulative, week ending September 19, 1998 (37th Week)
==================================================================================
                                             Cum. 1998
------------------------------------------------------
Anthrax                                              -
Brucellosis                                         39
Cholera                                              7
Congenital rubella syndrome                          3
Cryptosporidiosis*                               2,391
Diphtheria                                           2
Encephalitis:  California*                          49
               eastern equine*                       3
               St. Louis*                            2
               western equine*                       -
Hansen Disease                                      85
Hantavirus pulmonary syndrome*+                     17
Hemolytic uremic syndrome, post-diarrheal*          50
HIV infection, pediatric*&                         164
Plague                                               6
Poliomyelitis, paralytic                             1
Psittacosis                                         30
Rabies, human                                        -
Rocky Mountain spotted fever (RMSF)                217
Streptococcal disease, invasive Group A          1,638
Streptococcal toxic-shock syndrome*                 40
Syphilis, congenital@                              268
Tetanus                                             30
Toxic-shock syndrome                                95
Trichinosis                                          9
Typhoid fever                                      237
Yellow fever                                         -
------------------------------------------------------
-: no reported cases
 * Not notifiable in all states
 + Updated weekly from reports to the Division of Viral and Rickettsial
   Diseases, National Center for Infectious Diseases (NCID).
 & Updated monthly to the Division of HIV/AIDS Prevention -- Surveillance
   and Epidemiology, National Center for HIV, STD, and TB Prevention
   (NCHSTP), last update August 30, 1998.
 @ Updated from reports to the Division of STD Prevention, NCHSTP.

==================================================================================

Return to top.

Table_II
Note: To print large tables and graphs users may have to change their printer settings to landscape and use a small font size.

TABLE II. (page 1) Provisional cases of selected notifiable diseases, United States, weeks ending
September 19, 1998, and September 13, 1997 (37th Week)

                                                                  Escherichia
                                                                 coli O157:H7
                                                              -------------------                                Hepatitis
                          AIDS*             Chlamydia          NETSS**   PHLIS***         Gonorrhea               C\NA,NB
                   -----------------   --------------------   --------   --------    -------------------      ----------------
                     Cum.       Cum.        Cum.       Cum.       Cum.       Cum.        Cum.       Cum.       Cum.       Cum.
Reporting Area       1998       1997        1998       1997       1998       1998        1998       1997       1998       1997
------------------------------------------------------------------------------------------------------------------------------
UNITED STATES      31,523     40,204     378,895    319,775      2,043      1,217     228,605    202,696      2,732      2,513

NEW ENGLAND         1,194      1,732      13,698     12,375        254        193       3,937      4,165         37         46
Maine                  22         42         692        657         29          -          49         41          -          -
N.H.                   28         26         666        560         33         36          70         72          -          -
Vt.                    17         31         298        284         12          7          26         37          -          2
Mass.                 604        598       5,917      5,081        123        113       1,535      1,525         34         37
R.I.                   88        113       1,634      1,423         11          1         265        330          3          7
Conn.                 435        922       4,491      4,370         46         36       1,992      2,160          -          -

MID. ATLANTIC       8,893     12,414      45,639     40,763        209         60      26,047     26,621        280        234
Upstate N.Y.        1,014      1,931           N          N        151          -       3,923      4,468        216        173
N.Y. City           5,005      6,451      24,987     19,111          5         10      11,028      9,713          -          -
N.J.                1,655      2,598       7,566      7,000         53         40       4,852      5,441          -          -
Pa.                 1,219      1,434      13,086     14,652          N         10       6,244      6,999         64         61

E.N. CENTRAL        2,276      3,016      62,857     42,462        316        215      43,838     27,839        382        430
Ohio                  485        663      17,804     15,242         87         48      11,294     10,026          7         14
Ind.                  379        408       4,656      6,461         73         38       2,974      4,308          4         12
Ill.                  888      1,176      18,087          U         78         14      14,882          U         24         72
Mich.                 390        581      15,203     13,030         78         49      11,646     10,203        347        308
Wis.                  134        188       7,107      7,729          N         66       3,042      3,302          -         24

W.N. CENTRAL          599        778      21,792     22,422        322        228      10,956      9,859        228         47
Minn.                 119        136       4,360      4,616        135         98       1,623      1,625          9          3
Iowa                   51         78       2,063      3,051         84         42         660        803          7         23
Mo.                   282        377       8,475      8,413         26         46       6,235      5,194        206          8
N. Dak.                 4         10         616        598         10         13          51         40          -          2
S. Dak.                13          7       1,105        903         22         21         175         97          -          -
Nebr.                  56         71       1,428      1,703         26          -         505        676          2          2
Kans.                  74         99       3,745      3,138         19          8       1,707      1,424          4          9

S. ATLANTIC         7,960      9,668      77,081     65,916        175        114      63,804     64,987        139        166
Del.                  104        174       1,799          -          -          2       1,002        858          -          -
Md.                   914      1,167       5,336      5,028         27         12       5,942      8,161          7          4
D.C.                  635        717           N          N          1          -       2,588      3,086          -          -
Va.                   650        769       9,420      8,131          N         38       6,242      5,672         11         21
W. Va.                 60         77       1,840      2,084          8          5         546        654          6         13
N.C.                  536        597      15,541     12,084         43         36      13,482     11,958         18         38
S.C.                  507        535      12,980      8,874          8          5       8,403      8,289          3         32
Ga.                   846      1,161      16,173     11,545         56          -      14,401     13,470          9          -
Fla.                3,708      4,471      13,992     18,170         32         16      11,198     12,839         85         58

E.S. CENTRAL        1,273      1,366      27,675     24,322         84         28      27,239     24,333        152        264
Ky.                   195        237       4,477      4,593         22          -       2,561      2,907         18         11
Tenn.                 434        570       9,405      8,947         38         24       8,254      7,655        127        176
Ala.                  372        334       7,174      5,902         21          2       9,308      8,272          5          7
Miss.                 272        225       6,619      4,880          3          2       7,116      5,499          2         70

W.S. CENTRAL        3,799      4,171      58,582     41,753        102         12      33,993     28,045        491        323
Ark.                  136        159       2,599      2,120          8          6       1,247      3,463          9         10
La.                   654        733      10,851      6,629          5          2       9,311      6,285         33        153
Okla.                 224        216       7,054      5,295         12          4       3,854      3,518          9          7
Tex.                2,785      3,063      38,078     27,709         77          -      19,581     14,779        440        153

MOUNTAIN            1,052      1,127      14,864     20,677        266        178       5,654      5,488        298        214
Mont.                  20         33         924        734         14          -          30         34          7         16
Idaho                  19         37       1,217      1,110         30          7         119         92         87         44
Wyo.                    1         13         399        414         51         53          18         41         70         51
Colo.                 209        292          10      4,870         59         45       1,616      1,396         22         23
N. Mex.               166        112       2,508      2,689         17         13         623        614         74         40
Ariz.                 385        269       7,537      7,568         21         25       2,724      2,492          3         24
Utah                   91         93       1,527      1,193         64         21         163        186         21          3
Nev.                  161        278         742      2,099         10         14         361        633         14         13

PACIFIC             4,477      5,932      56,707     49,085        315        189      13,137     11,359        725        789
Wash.                 303        454       7,569      6,380         65         56       1,297      1,357         15         21
Oreg.                 128        222       4,062      3,432         86         86         587        526          5          3
Calif.              3,919      5,170      42,125     36,982        160         35      10,691      8,839        650        643
Alaska                 17         42       1,332      1,064          4          -         228        278          1          -
Hawaii                110         44       1,619      1,227          N         12         334        359         54        122

Guam                    -          2         201        193          N          -          24         27          -          -
P.R.                1,246      1,381           U          U          6          U         263        432          -          -
V.I.                   19         74           N          N          N          U           U          U          U          U
Amer. Samoa             -          -           U          U          N          U           U          U          U          U
C.N.M.I.                -          1           N          N          N          U          28         17          -          2
------------------------------------------------------------------------------------------------------------------------------
N: Not notifiable    U: Unavailable    -: no reported cases    C.N.M.I.: Commonwealth of North Mariana Islands

  * Updated monthly to the Division of HIV/AIDS Prevention, -- Surveillance and Epidemiology, National Center for HIV, STD,
    and TB Prevention, last update August 30, 1998.
 ** National Electronic Telecommunications System for Surveillance.
*** Public Health Laboratory Information System.

=======================================================================================================================================================

TABLE II. (page 2) Provisional cases of selected notifiable diseases, United States, weeks ending
September 19, 1998, and September 13, 1997 (37th Week)

                                                 Lyme                                     Syphilis                                  Rabies,
                     Legionellosis              Disease              Malaria        (Primary & Secondary)      Tuberculosis         Animal
                    ----------------       ----------------      ----------------   ---------------------    -----------------      -------
                     Cum.       Cum.        Cum.       Cum.       Cum.       Cum.        Cum.       Cum.       Cum.       Cum.        Cum.
Reporting Area       1998       1997        1998       1997       1998       1997        1998       1997       1998 *     1997        1998
-------------------------------------------------------------------------------------------------------------------------------------------
UNITED STATES         846        652       8,415      8,288        900      1,308       5,121      6,025     10,177     12,546       5,021

NEW ENGLAND            54         57       2,147      2,234         45         70          54        110        327        309       1,039
Maine                   1          2           6          8          4          1           1          -          5         17         151
N.H.                    3          6          32         21          4          8           1          -          9         10          47
Vt.                     4         10           8          6          -          2           4          -          2          4          50
Mass.                  24         21         590        262         15         25          35         54        187        172         375
R.I.                   13          5         346        277          4          5           1          2         39         27          67
Conn.                   9         13       1,165      1,660         18         29          12         54         85         79         349

MID. ATLANTIC         205        133       5,235      4,717        219        387         183        291      2,014      2,224       1,151
Upstate N.Y.           68         38       3,030      1,937         64         54          24         29        254        304         809
N.Y. City              23         14          18        141         97        241          46         64      1,044      1,120           U
N.J.                   11         19         808      1,431         34         71          55        116        422        459         142
Pa.                   103         62       1,379      1,208         24         21          58         82        294        341         200

E.N. CENTRAL          258        206          80        420         89        122         693        462        845      1,273         107
Ohio                   99         79          57         29         10         16          94        156         75        216          48
Ind.                   47         30          17         23         10         12         150        119         78        101           9
Ill.                   25         18           5         11         27         52         262          U        444        660          11
Mich.                  58         50           1         22         37         30         141        102        245        209          30
Wis.                   29         29           U        335          5         12          46         85          3         87           9

W.N. CENTRAL           59         37         156         82         68         42          94        131        272        396         533
Minn.                   5          1         127         56         39         19           6         15        104        106          97
Iowa                    8          9          20          5          8          8           -          6         28         46         120
Mo.                    20          7           1         15         10          8          72         83         88        156          19
N. Dak.                 -          2           -          -          2          2           -          -          7          9         108
S. Dak.                 3          2           -          1          -          -           1          -         16          9         109
Nebr.                  16         12           3          2          1          1           4          2         11         14           6
Kans.                   7          4           5          3          8          4          11         25         18         56          74

S. ATLANTIC           102         86         590        575        212        229       2,099      2,475      1,424      2,349       1,476
Del.                    9          9          12        104          2          4          17         17          U         23          17
Md.                    22         14         430        372         63         70         471        682        208        224         351
D.C.                    6          3           4          7         14         12          53         82         78         75           -
Va.                    16         19          50         39         39         55         116        176        187        220         427
W. Va.                  N          N           9          4          1          -           2          3         30         45          62
N.C.                    8         11          42         25         18         13         543        617        278        310         136
S.C.                    7          4           4          2          5         11         214        280        195        238         104
Ga.                     7          -           5          1         27         25         524        393        360        432         223
Fla.                   25         26          34         21         43         39         159        225         70        782         156

E.S. CENTRAL           50         42          66         67         23         28         872      1,305        815        936         218
Ky.                    23          8          13         12          4          8          79        102        126        122          28
Tenn.                  15         25          38         31         12          7         406        556        243        334         115
Ala.                    5          2          14          5          5         10         210        332        287        306          73
Miss.                   7          7           1         19          2          3         177        315        159        174           2

W.S. CENTRAL           19         12          22         60         24         17         758        880      1,509      1,817         125
Ark.                    -          1           6         16          1          4          80        120         90        134          29
La.                     2          2           3          2         11          8         302        257        106        159           -
Okla.                   8          1           2         12          4          5          72         87        126        152          96
Tex.                    9          8          11         30          8          -         304        416      1,187      1,372           -

MOUNTAIN               48         43          12          8         43         59         154        121        286        411         153
Mont.                   2          1           -          -          1          2           -          -         16          6          44
Idaho                   2          2           3          3          7          -           1          1          8          7           -
Wyo.                    1          1           -          1          -          2           1          -          4          2          53
Colo.                  13         16           3          -         15         26           8         10          U         66          19
N. Mex.                 2          2           4          1         11          8          19          5         43         43           5
Ariz.                  10          9           -          1          8          9         119         91        138        185          12
Utah                   17          8           -          -          1          3           3          5         43         26          19
Nev.                    1          4           2          2          -          9           3          9         34         76           1

PACIFIC                51         36         107        125        177        354         214        250      2,685      2,831         219
Wash.                   9          6           6          6         16         18          23          8        154        226           -
Oreg.                   -          -          14         16         13         18           5          5         99        114           3
Calif.                 40         29          86        103        144        309         184        235      2,278      2,293         193
Alaska                  1          -           1          -          1          3           1          1         35         60          23
Hawaii                  1          1           -          -          3          6           1          1        119        138           -

Guam                    2          -           -          -          1          -           1          3         36         13           -
P.R.                    -          -           -          -          -          5         148        175         68        164          39
V.I.                    U          U           U          U          U          U           U          U          U          U           U
Amer. Samoa             U          U           U          U          U          U           U          U          U          U           U
C.N.M.I.                -          -           -          -          -          -         164          9         77          2           -

-------------------------------------------------------------------------------------------------------------------------------------------
N: Not notifiable    U: Unavailable    -: no reported cases
 * Additional information about areas displaying 'U' for cumulative Tuberculosis cases can be found in Notices to Readers, MMWR Vol. 47, No. 2, p. 39.

=======================================================================================================================================================

Return to top.

Table_III
Note: To print large tables and graphs users may have to change their printer settings to landscape and use a small font size.

TABLE III. (page 1) Provisional cases of selected notifiable diseases preventable by vaccination, United
States, weeks ending September 19, 1998, and September 13, 1997 (37th Week)

                                                Hepatitis (Viral), by type                                    Measles (Rubeola)
                     H. influenzae,       ---------------------------------------        ------------------------------------------------------------
                        invasive                  A                     B                  Indigenous            Imported**                Total
                    ----------------      -----------------     -----------------        ---------------       ---------------        ---------------
                     Cum.       Cum.        Cum.       Cum.       Cum.       Cum.                   Cum.                  Cum.        Cum.       Cum.
Reporting Area       1998*      1997        1998       1997       1998       1997        1998       1998       1998       1998        1998       1997
-----------------------------------------------------------------------------------------------------------------------------------------------------
UNITED STATES         776        800      15,404     19,637      5,790      6,606           -         31          -         20          51        114

NEW ENGLAND            51         45         189        486        126        122           -          1          -          2           3         19
Maine                   2          4          16         47          2          6           -          -          -          -           -          1
N.H.                    7          6           8         22         13          9           -          -          -          -           -          1
Vt.                     5          3          13          9          4          6           -          -          -          1           1          -
Mass.                  33         28          67        200         32         52           -          1          -          1           2         16
R.I.                    3          2          13        111         57         12           -          -          -          -           -          -
Conn.                   1          2          72         97         18         37           -          -          -          -           -          1

MID. ATLANTIC         108        122       1,032      1,527        794        971           -          8          -          5          13         23
Upstate N.Y.           45         38         258        240        214        204           -          1          -          1           2          5
N.Y. City              21         32         241        681        198        355           -          -          -          -           -          7
N.J.                   37         37         238        223        144        181           U          7          U          1           8          3
Pa.                     5         15         295        383        238        231           -          -          -          3           3          8

E.N. CENTRAL          130        133       2,300      2,026        612      1,064           -         11          -          3          14         10
Ohio                   42         73         243        240         57         59           -          -          -          1           1          -
Ind.                   35         13         118        216         74         77           -          2          -          1           3          -
Ill.                   45         32         376        549        117        202           -          -          -          -           -          7
Mich.                   4         15       1,439        873        338        313           -          9          -          1          10          2
Wis.                    4          -         124        148         26        413           -          -          -          -           -          1

W.N. CENTRAL           74         39       1,041      1,558        294        347           -          1          -          -           1         16
Minn.                  58         27          95        133         34         27           -          -          -          -           -          7
Iowa                    2          5         381        324         50         26           -          1          -          -           1          -
Mo.                     8          4         430        796        174        253           -          -          -          -           -          1
N. Dak.                 -          -           3         10          4          5           -          -          -          -           -          -
S. Dak.                 -          2          21         18          2          1           -          -          -          -           -          8
Nebr.                   -          1          29         72          9         12           -          -          -          -           -          -
Kans.                   6          -          82        205         21         23           -          -          -          -           -          -

S. ATLANTIC           160        124       1,354      1,206        835        868           -          3          -          5           8         11
Del.                    -          -           3         23          -          5           -          -          -          1           1          -
Md.                    43         45         235        143        118        119           -          -          -          1           1          2
D.C.                    -          -          42         17         10         25           -          -          -          -           -          1
Va.                    15         12         160        162         75         91           -          -          -          2           2          1
W. Va.                  4          3           4          8          5         11           -          -          -          -           -          -
N.C.                   23         19          90        147        159        180           -          -          -          -           -          2
S.C.                    3          4          24         77         27         79           -          -          -          -           -          1
Ga.                    34         23         407        266        125         95           -          1          -          1           2          1
Fla.                   38         18         389        363        316        263           -          2          -          -           2          3

E.S. CENTRAL           42         40         290        459        276        507           -          -          -          2           2          1
Ky.                     7          6          18         60         32         28           -          -          -          -           -          -
Tenn.                  23         24         173        280        193        328           -          -          -          1           1          -
Ala.                   10          8          56         67         50         50           -          -          -          1           1          1
Miss.                   2          2          43         52          1        101           -          -          -          -           -          -

W.S. CENTRAL           46         36       3,009      3,918      1,013        811           -          1          -          -           1          7
Ark.                    -          2          77        171         69         62           -          -          -          -           -          -
La.                    22          8          64        149         75        105           -          1          -          -           1          -
Okla.                  21         24         417      1,126         69         35           -          -          -          -           -          -
Tex.                    3          2       2,451      2,472        800        609           -          -          -          -           -          7

MOUNTAIN               76         70       2,255      3,089        596        632           -          -          -          -           -          8
Mont.                   -          -          74         58          5          7           -          -          -          -           -          -
Idaho                   -          1         197        102         27         27           -          -          -          -           -          -
Wyo.                    1          3          32         24          6         22           -          -          -          -           -          -
Colo.                  17         13         228        309         85        115           -          -          -          -           -          -
N. Mex.                 6          7         109        249        246        188           -          -          -          -           -          -
Ariz.                  41         28       1,371      1,562        138        148           U          -          U          -           -          5
Utah                    4          3         156        461         57         73           -          -          -          -           -          1
Nev.                    7         15          88        324         32         52           U          -          U          -           -          2

PACIFIC                89        191       3,934      5,368      1,244      1,284           -          6          -          3           9         19
Wash.                   7          4         771        394         77         52           -          -          -          1           1          2
Oreg.                  34         29         274        269         80         82           -          -          -          -           -          -
Calif.                 40        147       2,839      4,572      1,073      1,131           -          5          -          2           7         13
Alaska                  1          4          15         25          9         11           -          1          -          -           1          -
Hawaii                  7          7          35        108          5          8           -          -          -          -           -          4

Guam                    -          -           -          -          2          3           U          -          U          -           -          -
P.R.                    2          -          49        223        319        557           U          -          U          -           -          -
V.I.                    U          U           U          U          U          U           U          U          U          U           U          U
Amer. Samoa             U          U           U          U          U          U           U          U          U          U           U          U
C.N.M.I.                -          6           3          1         53         34           U          -          U          -           -          1
-----------------------------------------------------------------------------------------------------------------------------------------------------
N: Not notifiable    U: Unavailable     -: no reported cases

 * Of 184 cases among children aged <5 years, serotype was reported for 102 and of those, 39 were type b.
** For imported measles, cases include only those resulting from importation from other countries.
=======================================================================================================================================================

TABLE III. (page 2) Provisional cases of selected notifiable diseases preventable by vaccination, United
States, weeks ending September 19, 1998, and September 13, 1997 (37th Week)

                     Meningococcal
                        Disease                      Mumps                           Pertussis                          Rubella
                   -----------------        --------------------------       ---------------------------       ---------------------------
                     Cum.       Cum.                   Cum.       Cum.                   Cum.       Cum.                  Cum.        Cum.
Reporting Area       1998       1997        1998       1998       1997       1998        1998       1997       1998       1998        1997
------------------------------------------------------------------------------------------------------------------------------------------
UNITED STATES       1,963      2,430          11        352        438         94       3,773      3,809          3        319         135

NEW ENGLAND            76        150           -          4          8         15         636        687          -         38           1
Maine                   5         17           -          -          -          -           5          7          -          -           -
N.H.                    4         12           -          -          -          2          62         85          -          -           -
Vt.                     1          4           -          -          -          2          65        190          -          -           -
Mass.                  38         74           -          2          2         11         463        376          -          8           1
R.I.                    3         15           -          -          5          -           7         12          -          1           -
Conn.                  25         28           -          2          1          -          34         17          -         29           -

MID. ATLANTIC         179        250           -         19         47         11         403        296          -        130          31
Upstate N.Y.           46         68           -          4         10          7         210        119          -        111           4
N.Y. City              20         42           -          4          3          4          23         58          -         14          27
N.J.                   47         47           U          2          7          U           5         12          U          4           -
Pa.                    66         93           -          9         27          -         165        107          -          1           -

E.N. CENTRAL          296        360           -         59         53          5         391        398          -          -           6
Ohio                  113        132           -         23         19          2         191        109          -          -           -
Ind.                   51         40           -          5          7          -          83         39          -          -           -
Ill.                   73        105           -         10          8          2          49         55          -          -           2
Mich.                  34         52           -         21         16          1          51         47          -          -           -
Wis.                   25         31           -          -          3          -          17        148          -          -           4

W.N. CENTRAL          166        173           -         25         14          8         304        286          -         27           -
Minn.                  29         29           -         12          5          7         184        184          -          -           -
Iowa                   31         39           -          9          7          1          56         23          -          -           -
Mo.                    59         73           -          3          -          -          22         51          -          2           -
N. Dak.                 5          2           -          1          -          -           2          1          -          -           -
S. Dak.                 6          4           -          -          -          -           8          4          -          -           -
Nebr.                   9          8           -          -          1          -          10          5          -          -           -
Kans.                  27         18           -          -          1          -          22         18          -         25           -

S. ATLANTIC           342        413           5         42         53          9         228        327          2         15          62
Del.                    2          5           -          -          -          -           3          1          -          -           -
Md.                    24         38           -          -          1          -          40        101          -          1           -
D.C.                    -          7           -          -          -          -           1          3          -          -           1
Va.                    28         42           -          6          9          -          19         34          -          -           1
W. Va.                 12         14           -          -          -          -           1          6          -          -           -
N.C.                   47         78           -         10          9          1          76         89          2         11          52
S.C.                   48         43           -          6         10          -          22         20          -          -           6
Ga.                    75         78           -          1          8          -          18         11          -          -           -
Fla.                  106        108           5         19         16          8          48         62          -          3           2

E.S. CENTRAL          178        184           -         13         23          -          83        103          -          2           1
Ky.                    22         38           -          -          3          -          25         42          -          -           -
Tenn.                  56         62           -          1          3          -          31         31          -          1           -
Ala.                   76         61           -          7          7          -          24         20          -          1           1
Miss.                  24         23           -          5         10          -           3         10          -          -           -

W.S. CENTRAL          232        231           3         53         53          6         254        170          1         88           4
Ark.                   26         26           -          7          1          1          53         19          -          -           -
La.                    52         47           -          9         12          -           5         15          1          1           -
Okla.                  32         29           -          -          -          1          19         25          -          -           -
Tex.                  122        129           3         37         40          4         177        111          -         87           4

MOUNTAIN              111        141           1         29         51         29         700        886          -          5           7
Mont.                   4          7           -          -          -          -           7         15          -          -           -
Idaho                   9          8           -          4          2         24         225        482          -          -           2
Wyo.                    6          2           -          1          1          -           8          6          -          -           -
Colo.                  22         37           -          7          3          3         147        249          -          -           -
N. Mex.                19         24           N          N          N          -          78         75          -          1           -
Ariz.                  35         37           U          5         31          U         142         31          U          1           5
Utah                   11         11           1          5          7          2          67         14          -          2           -
Nev.                    5         15           U          7          7          U          26         14          U          1           -

PACIFIC               383        528           2        108        136         11         774        656          -         14          23
Wash.                  53         66           -          7         14          5         236        267          -          9           5
Oreg.                  65        100           N          N          N          3          68         31          -          -           -
Calif.                258        354           2         80         96          3         451        326          -          3          10
Alaska                  3          2           -          2          6          -          13         16          -          -           -
Hawaii                  4          6           -         19         20          -           6         16          -          2           8

Guam                    1          1           U          2          1          U           -          -          U          -           -
P.R.                    6          8           U          1          7          U           3          -          U          -           -
V.I.                    U          U           U          U          U          U           U          U          U          U           U
Amer. Samoa             U          U           U          U          U          U           U          U          U          U           U
C.N.M.I.                -          -           U          2          4          U           1          -          U          -           -

------------------------------------------------------------------------------------------------------------------------------------------
N: Not notifiable    U: Unavailable     -: no reported cases

=======================================================================================================================================================

Return to top.

Table_IV
Note: To print large tables and graphs users may have to change their printer settings to landscape and use a small font size.

TABLE IV. Deaths in 122 U.S. cities,* week ending
September 19, 1998 (37th Week)
===================================================================================================================================
                                                 All Causes, By Age (Years)
                          ------------------------------------------------------------------------        P&I**
Reporting Area            All Ages         >=65        45-64       25-44         1-24           <1        Total
---------------------------------------------------------------------------------------------------------------
NEW ENGLAND                    553          382          102          46           12           11           39
Boston, Mass.                  118           72           31          12            2            1            4
Bridgeport, Conn.               47           29           10           5            2            1            3
Cambridge, Mass.                26           21            4           1            -            -            6
Fall River, Mass.               30           23            4           3            -            -            2
Hartford, Conn.                 54           37           10           3            -            4            3
Lowell, Mass.                   17           11            5           -            1            -            1
Lynn, Mass.                     13            9            1           2            1            -            2
New Bedford, Mass.              18           13            4           1            -            -            2
New Haven, Conn.                43           27            6           7            2            1            6
Providence, R.I.                66           50           10           2            2            2            2
Somerville, Mass.                3            3            -           -            -            -            -
Springfield, Mass.              31           20            5           6            -            -            2
Waterbury, Conn.                31           25            4           2            -            -            1
Worcester, Mass.                56           42            8           2            2            2            5

MID. ATLANTIC                2,112        1,465          387         174           53           33          117
Albany, N.Y.                    41           29            5           5            1            1            5
Allentown, Pa.                  16           14            2           -            -            -            -
Buffalo, N.Y.                   92           59           19          11            2            1            3
Camden, N.J.                    31           23            2           2            3            1            5
Elizabeth, N.J.                  8            6            2           -            -            -            -
Erie, Pa.                       55           45            6           3            -            1            1
Jersey City, N.J.               27           20            4           2            -            1            -
New York City, N.Y.          1,165          799          227         100           22           17           52
Newark, N.J.                    51           22           13          11            4            1            2
Paterson, N.J.                  21           15            3           2            1            -            -
Philadelphia, Pa.              200          120           43          21           12            4           14
Pittsburgh, Pa.***              91           66           15           7            2            1            8
Reading, Pa.                    18           15            1           1            1            -            1
Rochester, N.Y.                123          102           12           3            4            2           12
Schenectady, N.Y.               19           13            3           3            -            -            -
Scranton, Pa.                   28           22            5           1            -            -            5
Syracuse, N.Y.                  95           70           21           1            1            2            8
Trenton, N.J.                   13            8            3           1            -            1            -
Utica, N.Y.                     18           17            1           -            -            -            1
Yonkers, N.Y.                    U            U            U           U            U            U            U

E.N. CENTRAL                 1,611        1,121          318         106           37           29           86
Akron, Ohio                     46           31           10           4            1            -            -
Canton, Ohio                    33           29            4           -            -            -            3
Chicago, Ill.                    U            U            U           U            U            U            U
Cincinnati, Ohio               122           89           20           9            2            2           15
Cleveland, Ohio                158          106           31          14            2            5            4
Columbus, Ohio                 210          139           50          12            4            5           10
Dayton, Ohio                   125           92           22           6            4            1            6
Detroit, Mich.                 212          112           66          20            9            5            5
Evansville, Ind.                45           34           10           1            -            -            2
Fort Wayne, Ind.                51           36           11           2            2            -            4
Gary, Ind.                       6            3            2           1            -            -            -
Grand Rapids, Mich.             53           42            5           2            2            2            1
Indianapolis, Ind.             159          111           33           8            5            2           13
Lansing, Mich.                  52           34           12           4            1            1            -
Milwaukee, Wis.                140          110           18           8            3            1           15
Peoria, Ill.                    58           50            4           -            1            3            1
Rockford, Ill.                  47           33            5           7            -            2            3
South Bend, Ind.                43           34            5           4            -            -            2
Toledo, Ohio                     U            U            U           U            U            U            U
Youngstown, Ohio                51           36           10           4            1            -            2

W.N. CENTRAL                   863          594          163          55           17           23           57
Des Moines, Iowa                59           44           12           2            1            -           11
Duluth, Minn.                   26           22            3           -            -            1            3
Kansas City, Kans.              21           16            4           1            -            -            2
Kansas City, Mo.               121           72           25          10            2            3            8
Lincoln, Nebr.                  35           28            5           1            1            -            3
Minneapolis, Minn.             205          145           35          12            5            6           14
Omaha, Nebr.                    97           65           19           8            2            3            4
St. Louis, Mo.                 122           70           32          10            5            5            2
St. Paul, Minn.                 79           66           11           2            -            -            7
Wichita, Kans.                  98           66           17           9            1            5            3

S. ATLANTIC                  1,278          813          277         121           38           29           70
Atlanta, Ga.                   156           90           36          26            3            1            2
Baltimore, Md.                 248          140           72          25            8            3           24
Charlotte, N.C.                110           80           19           4            1            6           13
Jacksonville, Fla.             123           84           24           8            4            3            2
Miami, Fla.                    111           75           25           8            2            1            -
Norfolk, Va.                    47           31            7           6            1            2            2
Richmond, Va.                   71           41           15           8            5            2            2
Savannah, Ga.                   63           35           18           5            3            2            3
St. Petersburg, Fla.            64           49            7           4            1            3            2
Tampa, Fla.                    184          133           33          10            4            4           14
Washington, D.C.                91           50           20          13            6            2            6
Wilmington, Del.                10            5            1           4            -            -            -

E.S. CENTRAL                   759          515          141          61           24           15           54
Birmingham, Ala.               170          106           33          16            8            4            9
Chattanooga, Tenn.              78           57           16           5            -            -            6
Knoxville, Tenn.                63           48           12           2            1            -            4
Lexington, Ky.                  58           40           11           4            1            2            5
Memphis, Tenn.                 158          103           26          17           10            2           19
Mobile, Ala.                    43           32            7           3            -            1            -
Montgomery, Ala.                58           44           12           1            -            1            4
Nashville, Tenn.               131           85           24          13            4            5            7

W.S. CENTRAL                 1,477          931          286         151           63           46           72
Austin, Tex.                    67           35           19          10            1            2            4
Baton Rouge, La.                44           20           14           6            2            2            -
Corpus Christi, Tex.            52           37            9           5            1            -            2
Dallas, Tex.                   193          106           45          26            7            9            2
El Paso, Tex.                   69           46           10           7            5            1            2
Ft. Worth, Tex.                105           67           27           8            1            2            7
Houston, Tex.                  369          224           70          47           17           11           31
Little Rock, Ark.               89           63           11           9            3            3            5
New Orleans, La.               140           83           27          15           11            4            -
San Antonio, Tex.              225          157           39          10           10            9           12
Shreveport, La.                 25           17            6           -            2            -            2
Tulsa, Okla.                    99           76            9           8            3            3            5

MOUNTAIN                       981          663          187          72           29           29           46
Albuquerque, N.M.               81           61           14           4            1            1            6
Boise, Idaho                    35           27            2           2            3            1            -
Colo. Springs, Colo.            58           39           11           3            3            2            2
Denver, Colo.                   87           60           15           9            1            2            8
Las Vegas, Nev.                234          156           57          14            4            2            7
Ogden, Utah                     35           23            3           6            2            1            1
Phoenix, Ariz.                 194          125           38          11            7           13            5
Pueblo, Colo.                   21           13            5           1            -            2            -
Salt Lake City, Utah           110           68           20          12            5            5            8
Tucson, Ariz.                  126           91           22          10            3            -            9

PACIFIC                      1,876        1,321          353         124           43           35          151
Berkeley, Calif.                22           10           10           2            -            -            1
Fresno, Calif.                  78           61           11           4            1            1            6
Glendale, Calif.                20           15            5           -            -            -            3
Honolulu, Hawaii                72           50           17           2            2            1           10
Long Beach, Calif.              73           51           18           2            1            1            8
Los Angeles, Calif.            417          296           76          29           10            6           24
Pasadena, Calif.                28           18            7           3            -            -            2
Portland, Oreg.                147          108           23           8            4            4            5
Sacramento, Calif.             201          139           37          11            7            7           31
San Diego, Calif.              161          108           28          11            7            7           25
San Francisco, Calif.          113           79           21          10            1            2            8
San Jose, Calif.               215          161           37          14            2            1           12
Santa Cruz, Calif.              39           28            8           2            1            -            7
Seattle, Wash.                 154          103           27          19            5            -            4
Spokane, Wash.                  41           29            8           1            2            1            2
Tacoma, Wash.                   95           65           20           6            -            4            3

TOTAL                   11,510****        7,805        2,214         910          316          250          692

---------------------------------------------------------------------------------------------------------------
U: Unavailable    -: no reported cases

   * Mortality data in this table are voluntarily reported from 122 cities in the United States, most of which have populations
     of 100,000 or more. A death is reported by the place of its occurrence and by the week that the death certificate was
     filed. Fetal deaths are not included.
  ** Pneumonia and influenza.
 *** Because of changes in reporting methods in this Pennsylvania city, these numbers are partial counts for the current
     week. Complete counts will be available in 4 to 6 weeks.
**** Total includes unknown ages.
===================================================================================================================================

Return to top.

Disclaimer   All MMWR HTML versions of articles are electronic conversions from ASCII text into HTML. This conversion may have resulted in character translation or format errors in the HTML version. Users should not rely on this HTML document, but are referred to the electronic PDF version and/or the original MMWR paper copy for the official text, figures, and tables. An original paper copy of this issue can be obtained from the Superintendent of Documents, U.S. Government Printing Office (GPO), Washington, DC 20402-9371; telephone: (202) 512-1800. Contact GPO for current prices.

**Questions or messages regarding errors in formatting should be addressed to mmwrq@cdc.gov.

Page converted: 10/06/98

HOME  |  ABOUT MMWR  |  MMWR SEARCH  |  DOWNLOADS  |  RSSCONTACT
POLICY  |  DISCLAIMER  |  ACCESSIBILITY

Safer, Healthier People

Morbidity and Mortality Weekly Report
Centers for Disease Control and Prevention
1600 Clifton Rd, MailStop E-90, Atlanta, GA 30333, U.S.A

USA.GovDHHS

Department of Health
and Human Services

This page last reviewed 5/2/01