
 |
|
 |
![]()

Healthy
People ... tracking the Nation's
health
|
Healthy People 2010
Progress Review
Focus Area 27
Tobacco Use Presentation
PowerPoint Presentation PPT 3.6 MB
Slide 1
Focus Area 27: Tobacco Use
Progress Review
Edward J. Sondik, National Center for Health Statistics
August 21, 2008
Slide 2
Tobacco Use
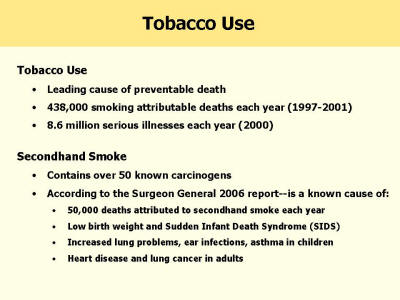
Tobacco Use
- Leading cause of preventable death
- 438,000 smoking attributable deaths each year (1997-2001)
- 8.6 million serious illnesses each year (2000)
- Contains over 50 known carcinogens
- According to the Surgeon General
2006 report--is a known cause of:
- 50,000 deaths attributed to secondhand smoke each year
- Low birth weight and Sudden Infant Death Syndrome (SIDS)
- Increased lung problems, ear infections, asthma in children
- Heart disease and lung cancer in adults
Slide 3
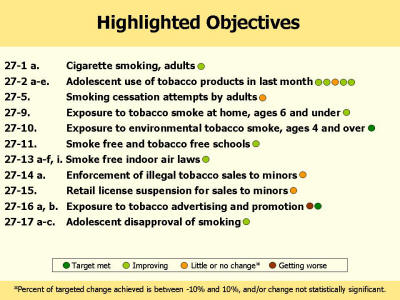
Highlighted objectives
Highlighted objectives with colored dots indicating status with regards to Healthy People target.
27-1 a. Cigarette smoking, adults (improving)
27-2 a-e. Adolescent use of tobacco products in last month
- Tobacco (improving)
- Cigarettes (improving)
- Spit tobacco (little or no change)
- Cigars (improving)
- Bidis (improving)
27-9. Exposure to tobacco smoke at home, ages 6 and under (improving)
27-10. Exposure to environmental tobacco smoke, ages 4 and over (target met)
27-11. Smoke free and tobacco free schools (improving)
27-13 a-f, i. Smoke free indoor air laws
- Private workplaces (improving)
- Public workplaces (improving)
- Restaurants (improving)
- Public transportation (improving)
- Day care centers (improving)
- Retail Stores (improving)
- Bars (improving)
27-15. Retail license suspension for sales to minors (little or no change)
27-16 a, b. Exposure to tobacco advertising and promotion
- Internet (getting worse)
- Magazines and Newspapers (target met)
- Eighth graders (improving)
- Tenth graders (improving)
- Twelfth graders (improving)
Slide 4
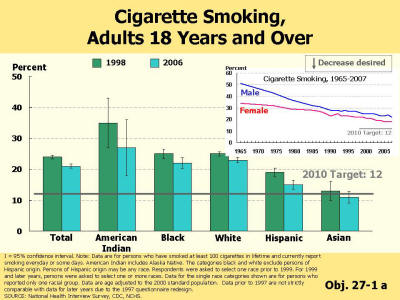
Cigarette Smoking, Adults 18 Years and Over
The percent of adult cigarette smokers is shown for the baseline year (1998) and the most recent data year in DATA2010 (2006). Racial ethnic groups shown are American Indian, Black, White, Hispanic, and Asian. Trend lines show the changes in the percent of adult cigarette smokers for males and females from 1965 through 2007.
Slide 5
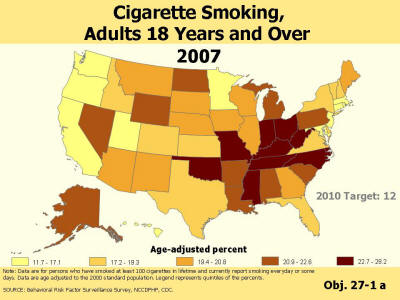
Cigarette Smoking, Adults 18 Years and Over
Map showing percent of adult cigarette smokers for States by quintiles of the percents
Slide 6
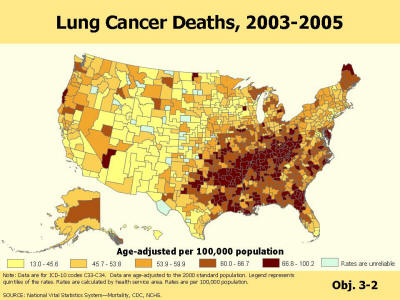
Lung Cancer Deaths, 2003 – 2005
Map showing lung cancer death rate quintiles for health service areas.
Slide 7
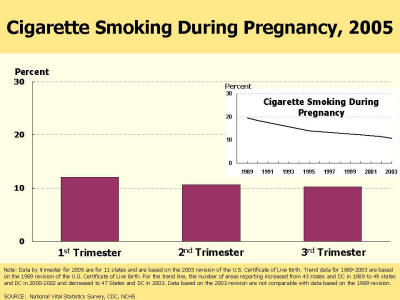
Cigarette Smoking During Pregnancy, 2005
Percent of women who smoked during pregnancy in 2005 is shown by trimester (data from States using the 2003 revision of the United States birth certificate). Trend line shows the changes in the percent of women who smoked during pregnancy from 1989 to 2003 (data from States using the 1989 revision of the United States birth certificate).
Slide 8
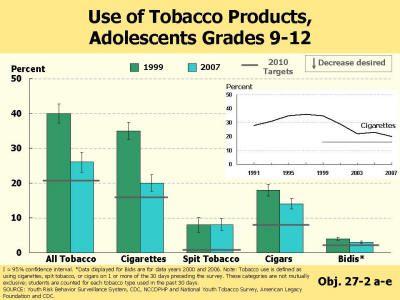
Use of Tobacco Products, Adolescents Grades 9 through 12
Percent of adolescents grades 9 through 12 using tobacco is shown for the baseline year (1999) and the most recent data year (2007). Tobacco categories shown are all tobacco, cigarettes, spit tobacco, cigars, and bidis. A trend line shows the change in the percent of adolescents smoking cigarettes from 1991 to 2007.
Slide 9
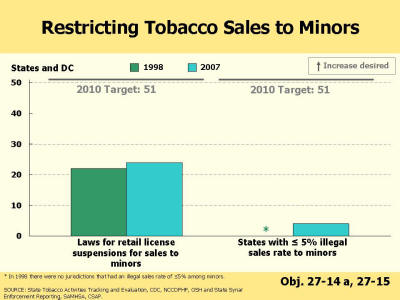
Restricting Tobacco Sales to Minors
The number of States and District of Columbia that have laws for retail license suspensions for sales to minors is shown for the baseline year (1998) and the most recent data year (2007). The number of States and District of Columbia that have an illegal sales rate of tobacco to minors of less than or equal to 5 percent is shown for the baseline year (1998) and the most recent data year (2007).
Slide 10
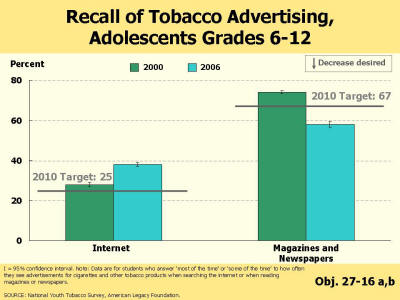
Recall of Tobacco Advertising, Adolescents Grades 6 through 12
Percent of adolescents grades 6 through 12 who reported seeing advertisements for tobacco products is shown for the baseline year (2000) and the most recent data year (2006). Two categories are shown: internet and magazines and newspapers.
Slide 11
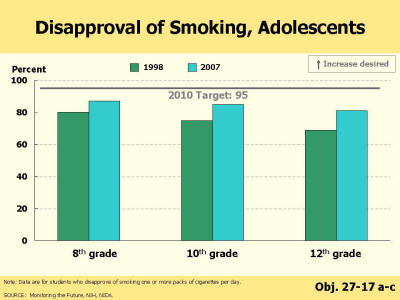
Disapproval of Smoking, Adolescents
Percent of adolescents who disprove of smoking one or more packs of cigarettes per day is shown for the baseline year (1998) and the most recent data year (2007). Data are shown for eighth, tenth, and twelfth graders.
Slide 12
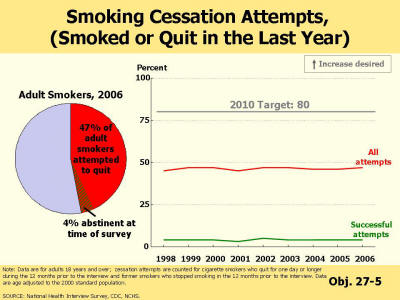
Smoking Cessation Attempts, (Smoked or Quit in the Last Year)
A pie chart shows the percent of adult smokers who tried to quit smoking for at least one day in the last year and the percent of adult smokers who had attempted to quit smoking in the last year and were currently abstinent at the time of the survey for 2006 data. Trend lines show the percent of adult smokers who tried to quit smoking for at least one day in the last year and the percent of adult smokers who had attempted to quit smoking in the last year and were currently abstinent at the time of the survey from the baseline year (1998) through the most recent data point (2006).
Slide 13
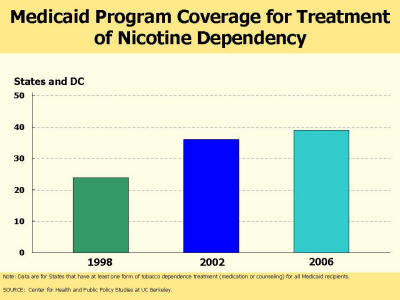
Medicaid Program Coverage for Treatment of Nicotine Dependency
Number of States and District of Columbia that have at least one form of tobacco dependence treatment for all Medicaid recipients is show for years 1998, 2002, and 2006.
Slide 14
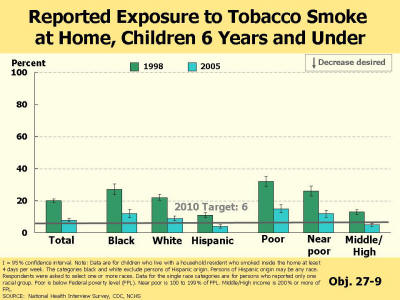
Reported Exposure to Tobacco Smoke at Home, Children 6 Years and Under
Percent of children 6 years and under who lived with a resident who smoked inside the home for at least 4 days per week is shown for the baseline year (1998) and the most recent data year (2005). Data are shown for the following categories: total, black, white, Hispanic, poor, near poor, and middle/high income.
Slide 15
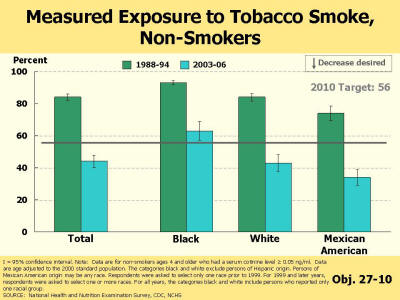
Measured Exposure to Tobacco Smoke, Non-Smokers
Percent of non-smokers who had a measured serum cotinine level greater than or equal to 0.05 nanograms per milliliter are shown for the baseline years (1988 through 1994) and the most recent data years (2003 through 2006). Data are shown for the following categories: total, black, white and Mexican American.
Slide 16
Tobacco-Free Schools
Two pie charts show the percent of schools that were tobacco free at the baseline year (1994) and at the most recent data year (2006).

Slide 17
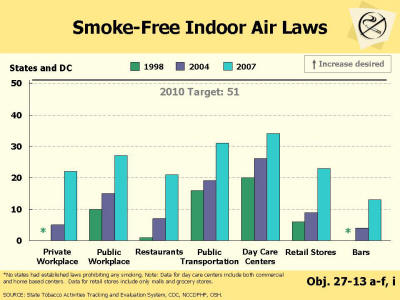
Smoke-Free Indoor Air Laws
The number of States and District of Columbia that have smoke-free indoor air laws are shown for the baseline year (1998), an intermediate year (2004), and the most recent data year (2007). Data are shown for the following categories: private workplace, public workplace, restaurants, public transportation, day care centers, retail stores, and bars.
Slide 18
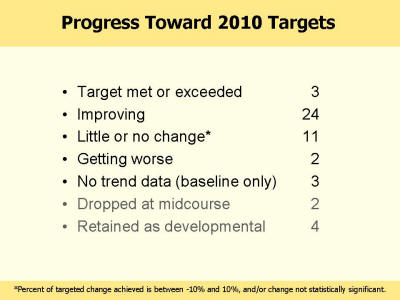
Progress Toward 2010 Targets
- Target met or exceeded - 3
- Improving - 24
- Little or no change* - 11
- Getting worse - 2
- No trend data (baseline only) - 3
- Dropped at midcourse - 2
- Retained as developmental - 4
Slide 19
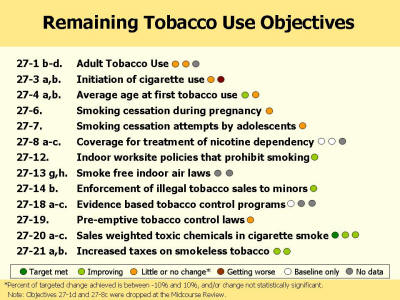
Remaining Tobacco Use Objectives
Shows the status Tobacco Use objectives that were not highlighted in this presentation.
27-1 b-d. Adult Tobacco Use
- Spit tobacco (little or no change)
- Cigars (little or no change)
- Other (dropped at midcourse review)
- Ages 12 to 17 years (little or no change)
- Ages 18 to 25 years (getting worse)
- Ages 12 to 17 years (improving )
- Ages 18 to 25 years (little or no change)
27-7. Smoking cessation attempts by adolescents (little or no change)
27-8 a-c. Coverage for treatment of nicotine dependency
- Managed care organizations (baseline only)
- Medicaid (baseline only)
- Insurance (dropped at midcourse review)
27-13 g,h. Smoke free indoor air laws
- Tribes (no data)
- Territories (no data)
27-18 a-c. Evidence based tobacco control programs
- States and District of Columbia (baseline only)
- Territories (no data)
- Tribes (no data)
- Nitrosamines (target met)
- Hydrocarbon compounds (improving)
- Volatile organic compounds (improving)
- Combined federal and average state tax on cigarettes (improving)
- Increased taxes on smokeless tobacco (improving)
Slide 20
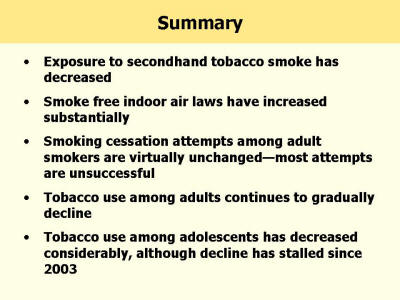
Summary
- Exposure to secondhand tobacco smoke has decreased
- Smoke free indoor air laws have increased substantially
- Smoking cessation attempts among adult smokers are virtually unchanged - most attempts are unsuccessful
- Tobacco use among adults continues to gradually decline
- Tobacco use among adolescents has decreased considerably, although decline has stalled since 2003
Slide 21
Acknowledgements
Lesley Agress
Health Statistician
CDC/National Center for Health Statistics
LKA7@cdc.gov
Contributors:
Allison MacNeil, CDC/OSH
Gabbi Promoff, CDC/OSH
Slide 22
This slide indicates that Progress Review data and slides can be found at: http://www.cdc.gov/nchs/hphome.htm.

Healthy People 2000 |
Healthy People 2010 | Related Links |
This page last reviewed
August 21, 2008
|
