
|
||||||
|
|
||||||
|
|
Preliminary Births for 2004: Infant and Maternal Healthby Joyce A. Martin, M.P.H.; Brady E. Hamilton, Ph.D.; Fay Menacker, Ph.D.; Paul D. Sutton, Ph.D.; and T.J. Mathews, M.S., Division of Vital Statistics This report from CDC’s National Center for Health Statistics summarizes selected 2004 preliminary maternal and infant health birth data for the United States. An earlier report highlighted demographic results from the 2004 birth data (1). A report that includes both demographic and health characteristics of births as well as State-based preliminary 2004 data is in preparation. Key findings for this report, illustrated in tables 1–3 and in figures 1 and 2, show:
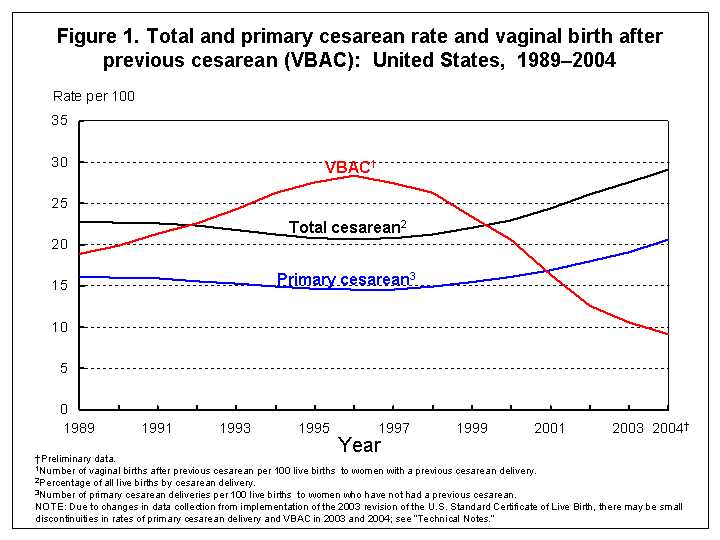
Nature and sources of data Preliminary data for 2004 are based on a substantial proportion of births for that year (99.1 percent). The data for 2004 are based on a continuous receipt and processing of statistical records through May 25, 2005, by the National Center for Health Statistics (NCHS). NCHS receives the data from the States’ vital registration systems through the Vital Statistics Cooperative Program. In this report, U.S. totals include only events occurring within the 50 States and the District of Columbia. Detailed information on reporting completeness and imputation procedures may be found in the Technical Appendix of Vital Statistics of the United States, 2003, "Natality" (4). To produce the preliminary estimates shown in this report, records in the file were weighted using independent control counts of all 2004 births by State of occurrence. Detailed information on weighting is available elsewhere (5). Detailed information on the reliability of estimates also may be found elsewhere (5). The comparability of items between the 1989 and 2003 U.S. Standard Certificates of Live Birth This report includes preliminary data for nine States: Florida, Idaho, Kentucky, New Hampshire, New York (excluding New York City), Pennsylvania, South Carolina, Tennessee, and Washington, which implemented the 2003 revision of the U.S. Standard Certificate of Live Birth in either 2003 or 2004 (revised States or data), as well as data from the other 41 States, and the District of Columbia, which collected and reported 2003 and 2004 birth data based on the 1989 revision of the U.S. Standard Certificate of Live Birth (unrevised States or data). The 2003 revision is described in detail elsewhere (6,7). Where comparable, data from revised States are combined with data from the remaining 41 States and the District of Columbia. Where revised data are not comparable, revised data are excluded from this report. Where data for only a portion of the year are revised (Florida and New Hampshire implemented the 2003 revision during the course of the year, that is, after January 1, 2004), both revised and unrevised data for items that are not comparable for the State are excluded. The 41 States, New York City, and the District of Columbia reported based on the 1989 revision accounted for 80 percent of U.S. births in 2004. Comparable data on tobacco were available for a 40 State reporting area plus New York City and the District of Columbia, accounting for 67 percent of all births. More detailed information on revised and unrevised data will be presented in a subsequent report based on the file birth file. Comparability of selected data items is discussed below. Data from the nine revised States (New York State excluding New York City) on prenatal care and tobacco use during pregnancy are excluded from this report. See "Births: Final Data for 2003" for information on the revised prenatal care and tobacco questions (2). Prenatal care and tobacco use data based on the 2003 revision will be presented in an upcoming report. Despite substantive changes between the 1989 and 2003 revisions of the birth certificate to the method of delivery item, data for all States are combined for national figures shown in this report. The total numbers and percentages of vaginal and cesarean deliveries appear to be very consistent between revisions. However, information on whether the delivery is a VBAC, primary cesarean, or repeat cesarean may be less comparable. This is because of wording and formatting changes designed to collect data on whether the mother had a previous cesarean delivery. The new format includes a direct question on whether the mother had had a previous cesarean delivery, whereas the old format did not. In brief, revised data show higher-than-expected VBAC and primary cesarean rates, and lower-than-expected repeat cesarean rates. These changes appear to have only a small impact on national rates and data for all States are included in the national figures shown in this report. However, measures which incorporate these data to compare changes across revisions for individual States should be interpreted with caution. Hispanic origin of mother Race and Hispanic origin are reported separately on the birth certificate. Data shown by race (that is, American Indian or Alaskan Native and Asian or Pacific Islander) include persons of Hispanic or non-Hispanic origin, and data for Hispanic origin include all persons of Hispanic origin of any race. Data are shown separately for non-Hispanic white and black women. Single, multiple, and bridged race of mother The 2003 revision of the U.S. Standard Certificate of Live Birth allows the reporting of more than one race (multiple races) for each parent (8). Information on this change is presented in a recent report (2). In 2004, multiple race was reported on the revised birth certificates of Florida, Idaho, Kentucky, New Hampshire, New York State (excluding New York city), Pennsylvania, South Carolina, Tennessee, and Washington, as well as on the unrevised certificates of California, Hawaii, Michigan, Minnesota, Ohio, and Utah (a total of 15 States). Data from the vital records of the remaining 35 States, the District of Columbia, and New York City are based on the 1989 revision of the U.S. Standard Certificate of Live Birth, which follows the 1977 Office of Management and Budget (OMB) standard, allowing only a single race to be reported (7,9,10). In order to provide uniformity and comparability of the data during the transition period, before all or most of the data are available in the new multiple race format, it was necessary to “bridge” the responses of those who reported more than one race (multiple race) to one, single race. Information on the processing and tabulation of data by race is presented in a recent report (2). References 1. Hamilton BE, Ventura SJ, Martin JA, Sutton PD. Preliminary births for 2004. Health E-Stats. National Center for Health Statistics. 2004. Available at: http://www.cdc.gov/nchs/products/pubs/pubd/hestats/ prelim_births/ prelim_births04.htm 2. Martin JA, Hamilton BE, Sutton PD, et al. Births: Final data for 2003. National vital statistics reports; vol 54 no 2. Hyattsville, MD: National Center for Health Statistics. 2005. Available at: http://www.cdc.gov/nchs/data/nvsr/nvsr54/nvsr54_02.pdf. 3. Mathews TJ, Menacker F, MacDorman MF. Infant mortality statistics from the 2002 period linked birth/infant death data set. National vital statistics reports; vol 53 no 10. Hyattsville, MD: National Center for Health Statistics. 2004. Available at: http://www.cdc.gov/nchs/data/nvsr/nvsr53/ nvsr53_10.pdf 4. U.S. Department of Health and Human Services. United States, 2003, vol I natality. Centers for Disease Control and Prevention. National Center for Health Statistics. Hyattsville, MD. Available at: http://www.cdc.gov/nchs/births.htm and included on the CD-ROM titled Vital Statistics of the United States, vol 1, Natality, 2003. 5. Hamilton BE, Martin JA , Sutton PD. Births: Preliminary data for 2003. National vital statistics reports; vol 53 no 9. Hyattsville, MD: National Center for Health Statistics. 2004. Available at: http://www.cdc.gov/nchs/data/nvsr/nvsr53/nvsr53_09.pdf. 6. National Center for Health Statistics. 2003 revision of the U.S. Standard Certificate of Live Birth. 2003. Available at: http://www.cdc.gov/nchs/vital_certs_rev.htm. 7. National Center for Health Statistics. Report of the Panel to Evaluate the U.S. Standard Certificates and Reports. National Center for Health Statistics. 2000. Available at: http://www.cdc.gov/nchs/data/dvs/panelreport_acc.pdf. 8. National Center for Health Statistics. U.S. Standard Certificate of Live Birth. 2003. Available at: http://www.cdc.gov/nchs/data/dvs/birth11-03final-ACC.pdf. 9. Office of Management and Budget. Revisions to the standards for the classification of Federal data on race and ethnicity. Federal Register 62FR58781–58790. Accessed October 30, 1997. Available at: http://www.whitehouse.gov/omb/fedreg/ombdir15.html. 10. Office of Management and Budget. Race and ethnic standards for Federal statistics and administrative reporting. Statistical Policy Directive 15. 1977.
Suggested citation Martin JA, Hamilton BE, Menacker F, Sutton PD, Mathews T.J. Preliminary births for 2004: Infant and maternal health. Health E-stats. Hyattsville, MD: National Center for Health Statistics. Released November 15, 2005. Acknowledgments This report was prepared under the general direction of Charles J. Rothwell, Director of the Division of Vital Statistics (DVS) and Stephanie J. Ventura, Chief of the Reproductive Statistics Branch (RSB). Nicholas F. Pace, Chief of the Systems, Programming, and Statistical Resources Branch (SPSRB), Steven J. Steimel, David P. Johnson, Candace M. Cosgrove, Annie Liu, Jaleh Mousavi, Manju Sharma, and Jordan A. Sacks provided computer programming support and statistical tables. Colleen S. Choi of RSB provided content review. Staff of the Data Acquisition and Evaluation Branch carried out quality evaluation and acceptance procedures for the State data files on which this report is based and were responsible for receipt and processing of the basic data file. The Registration Methods staff of DVS consulted with State vital statistics offices regarding the collection of birth certificate data. This report was edited by Demarius V. Miller, produced by Tommy C. Seibert Jr., and posted by Christine J. Brown of the Office of Information Services, Information Design and Publishing Staff.
This page last reviewed October 15, 2008
|