|
|||
|
NIOSH Publication No. 97-143:Child Labor Research Needs |
August 1997 |
|
Recommendations from the NIOSH Child Labor Working TeamBackground Historical IssuesHistorically, regulation of child labor has been motivated by both economic issues and concerns for the safety, health, and normal development of children. In the early part of this century, children were viewed as a potential source of cheap labor who competed with adults for jobs at the cost of their health and education. Early efforts to regulate child labor were made at the State and national levels, but early Federal legislation was challenged in the courts and ruled to be unconstitutional. In 1938, passage of the Fair Labor Standards Act (FLSA) provided the basis for regulating child labor at the Federal level. The FLSA, as amended [29 USC* Ch. 8 201219], is still the basic Federal statute dealing with child labor. The growth of child labor in recent decades again threatens to interfere with education and poses threats to the safety and health of children. Before 1945, it was unusual for children to work while attending school; but by the 1980s, about one third of students held jobs during the academic year. The workplace has become an important factor in adolescent development. *United States Code.Data on Youth EmploymentLimited information is available at the national level for characterizing youth employment and calculating rates of injuries and illnesses. The Current Population Survey (CPS) conducted for the Bureau of Labor Statistics (BLS) is a monthly survey of U.S. households selected from a probability sample of the civilian noninstitutionalized population. In 1995, an estimated 2.6 million (35%) of the Nations adolescents aged 16 and 17 were employed [BLS 1996]. Comparisons of employment data from the CPS and longitudinal surveys suggest that the CPS underestimates youth employment [GAO 1991]. One reason may be their use of proxy respondents. Because data are not routinely collected for youths aged 14 and younger, it is not possible to estimate the number of the Nations youngest workers and, consequently, their rates of injury and illness. High school surveys suggest that about 80% of students are employed at some time during their high school years [Steinberg and Cauffman 1995]. Data suggest that in 1975, the United States had twice the proportion of children under age 15 in the workforce as other industrial countries [Richter and Jacobs 1991]. |
|
|||||||||||||||||||||||||||||||||||||||||||||||||||||||||||||||||||||||||||||||||||||||||||||||||||||||||||||||||||||||||||||||||||||||||||||||||||||||||||||||||||||||||||||||||||||||||||||||||||||||||||||||||||||||||||||||||||||||||||||||||||||||||||||||||||||||||||||||||||||||||||||||||||||||||||||||||||||||||||||||||||||||||||||||||||||||||||||||||||||||||||||||||||||||||||||||||||||||||||||||||||||||||||||||||||||||||||||||||||||||||||||||||||||||||||||||||||||||||||
|
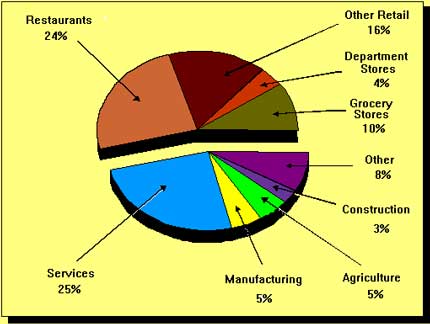
Figure 1. Types of jobs held by youths in 1990. (Data from Children's Safety Network [1995].) Because youth employment data are frequently difficult to access at the State level, research within States and comparisons across States are hampered. State-specific employment data from the CPS are published using the group aged 16 to 19 [BLS 1995a], though analyses for youths under age 18 are possible within individual States [Belville et al. 1993]. Decennial census data can be analyzed at the State level [Brooks and Davis 1996; Miller 1995; Banco et al. 1992]; but they may not correspond with the years of injury and illness data, and they may require the assumption that youth employment is stable over time. A survey of teens was used to estimate employment in one State [Parker et al. 1994a]. One group calculated injury and illness rates based on issued child labor documents [State of Wyoming 1984], and another reported rates per capita [Brooks et al. 1993]. Others have reported State-specific injury and illness data without calculating rates based on employment data [Cooper and Rothstein 1995; Bush and Baker 1994; Heyer et al. 1992]. When examining employment patterns of children under age 18, it is important to recognize that work is frequently in addition to school attendance. Thus working 20 hr per week during the school year approximates a 50 hr workweek, not considering homework or extracurricular activities. Youth employment is clustered in occupations that mirror the emerging workforce. Service workers are projected to become the largest group of workers in the near future [Silvestri 1994], and temporary or part-time jobs are increasingly common [NIOSH 1996b]. Most youths work part time, and many work in service occupations. Occupational safety and health issues in working children may highlight issues that will arise as the Nations workforce is transformed. Occupational Injury and Illness Data for YouthsFatal InjuriesNational Level Analyses
The IMIS database included 104 deaths of children under age 18 for the years 1984-87 [Suruda and Halperin 1991]. Citations for safety violations were issued in 70% of these deaths, and 41% of the deaths involved work prohibited by Federal child labor laws. Fourteen of the 104 deaths were of children under age 15. These figures do not represent all work-related deaths of children during this period, since OSHA fatality investigations are concentrated in construction and manufacturing, and OSHA does not investigate transportation or violence-related deaths. The NTOF Surveillance System reports 784 deaths of adolescents aged 16 and 17 for the period 1980-92 [NIOSH 1997]. This figure is a conservative count of work-related fatalities of children during this period because death certificates alone identify only about 80% of work-related deaths, and the NTOF Surveillance System does not include workers under age 16 [Castillo et al. 1994]. The leading causes of death were incidents involving motor vehicles, machines, electrocution, and homicide. The fatality rate for adolescents aged 16 and 17 was 5.1 per 100,000 full-time equivalent workers for the 10-year period 1980-89 [Castillo et al. 1994]. The rate for adults aged 18 and older was 6.1. This relatively small difference in rates is cause for concern because youths under age 18 are employed less frequently in especially hazardous jobs. The CFOI identified 67 to 68 work-related deaths of children under age 18 each year from 1992 to 1994 [Toscano and Windau 1994, 1995; Derstine 1994]. In 1994, 25 deaths of workers under age 16 and 42 deaths of workers aged 16 and 17 occurred [Toscano and Windau 1995]. Agricultural business and retail trades accounted for the most deaths [NIOSH 1995; Derstine 1994]. Many of the deaths of adolescents occurred in family businesses. Highway events accounted for the most deaths: 20% of the deaths of youths under age 16 and 26% of the deaths of adolescents aged 16 and 17. CFOI data suggest that homicide accounts for a larger proportion of the deaths of working adolescents than indicated by NTOF for the 1980s. Homicide accounted for 10% of the occupational injury deaths of adolescents aged 16 and 17 during 1980-89 [Castillo et al. 1994] compared with 28% in 1993 [Toscano and Windau 1994]. Because of differences between the NTOF and CFOI systems, it is not possible to determine whether the incidence of homicide has increased in the 1990s or whether homicides of youths were under reported in NTOF during the 1980s. State Level Analyses Comprehensive information from FACE investigations has been very informative. An investigation by the Iowa FACE Program is a good example [Iowa FACE Program 1995]. A 12-year-old boy, who was working part time for a farmer, died after he lost control and overturned a tractor in a roadside ditch. The investigation identified two factors that may have contributed to the incident: the distance from the seat to the brakes (which was too long for the boy) and the loader frame on the tractor (which may have obstructed the boys view of the front wheels, making it difficult to see the exact position of the front wheel and the edge of the road). The farmer reported that the boy had read books on tractor safety and was a good student.
Source: NTOF Surveillance System [NIOSH 1997].
| ||||||||||||||||||||||||||||||||||||||||||||||||||||||||||||||||||||||||||||||||||||||||||||||||||||||||||||||||||||||||||||||||||||||||||||||||||||||||||||||||||||||||||||||||||||||||||||||||||||||||||||||||||||||||||||||||||||||||||||||||||||||||||||||||||||||||||||||||||||||||||||||||||||||||||||||||||||||||||||||||||||||||||||||||||||||||||||||||||||||||||||||||||||||||||||||||||||||||||||||||||||||||||||||||||||||||||||||||||||||||||||||||||||||||||||||||||||||||||||
| % total cases | |
| Eating and drinking places | 39 |
| Grocery stores | 14 |
| Nursing and personal care facilities | 6 |
| Department stores | 5 |
The most common events resulting in injury were as follows:
| % total cases | |
| Falls on the same level (includes falls to floors and falls onto or against objects) | 21 |
| Injuries from overexertion (includes injuries from lifting, pulling, pushing, turning, wielding, holding, carrying, or throwing objects) | 17 |
| Striking against objects (includes bumping into, stepping on, kicking, and being pushed or thrown into or against objects) | 10 |
| Contact with hot objects | 9 |
| Being struck by falling objects | 7 |
| Being struck by a slipping hand held object (such as a knife, razor, or tool) | 6 |
NEISS is a probability sample of 91 hospital emergency departments in the United States [Layne et al. 1994]. Previous research indicates that only one-third of work-related injuries are seen in emergency rooms [Ries 1978]. An estimated 64,000 adolescents aged 14 to 17 required treatment in hospital emergency rooms for work-related injuries in 1992 [Layne et al. 1994]. The rate of injury for workers aged 15 to 17 was estimated to be 5.8 per 100 full-time equivalent employees. Because the NEISS was limited to young workers in 1992, it was not possible to contrast the rates for adolescents to those of adults. In a previous surveillance effort in which data were collected for workers of all ages, rates for workers aged 16 and 17 were exceeded only by the rate for workers aged 18 and 19 [Coleman and Sanderson 1983]. Based on emergency department data, a study of all injuries to children in Massachusetts during the early 1980s suggests that work contributes substantially to adolescent injuries [Brooks et al. 1993]. Among adolescents aged 14 to 17, 7% to 13% of all injuries seen in the emergency department were attributed to work. Among adolescents aged 17, work injuries constituted 14% to 26% of all injuries seen in the emergency department.
Retail trades had both the highest frequency and rate of adolescent injuries treated in the emergency department [Layne et al. 1994]. Fifty-four percent of adolescent occupational injuries were attributed to work in retail trades, with a rate of 6.3 injuries per 100 full-time equivalent employees. Restaurants accounted for nearly three-fourths of these injuries in the retail trades.
The service industry sector had the next highest frequency of adolescent occupational injuries: nearly two-thirds of the injuries in the service industry occurred in health services, amusement and recreation, and educational services [Layne et al. 1994]. The most frequent types of injuries in adolescent workers were as follows:
| % total cases | |
| Lacerations | 35 |
| Contusions | 18 |
| Sprains | 16 |
| Burns | 12 |
| Fractures and dislocations | 4 |
| All other | 15 |
Telephone interviews were conducted with adolescents aged 14 to 16 who were identified in the surveillance system within the first 3 months of surveillance [Knight et al. 1995]. Sixty-eight percent of these youths experienced limitations in their normal activities (including work, school, and play) for at least 1 day, and 25% experienced limitation in their normal activities for more than a week.
State-Level Analyses
Workers compensation claims reported to the BLS Supplementary Data System were analyzed for injuries to children under age 18 in 24 States for the years 1980-83 [Schober et al. 1988]. Of the 23,823 claims reported, approximately 10% occurred in children under age 16. Workers compensation data have also been reported for workers under age 18 in 8 States: Massachusetts
[Brooks and Davis 1996], Texas [Cooper and Rothstein 1995], Washington [Miller 1995; Heyer et al. 1992], California [Bush and Baker 1994], Minnesota [Parker et al. 1994a], New York [Belville et al. 1993], Connecticut [Banco et al. 1992], and Wyoming [State of Wyoming 1984]. State-specific data from the SOII have been reported for the 42 States participating in the Federal/State cooperative agreement for 1993 [CDC 1996b] [Table 2 -- also available in PDF format (575KB, 7 pages)], and analyses have been done using emergency department data [Brooks et al. 1993] and survey methodology [Parker et al. 1994b] in individual States.
| State† | Estimated frequency | Median days away from work | Frequent industries‡ (% total cases) |
Frequent events and exposures§ (% total cases) |
| Alabama | 330 | 6 | Eating and drinking places (32%) Grocery stores (16%) |
Fall on same level (23%) Overexertion in lifting (18%) Struck by object not elsewhere classified (12%) |
| Alaska | 86 | 3 | Laundry, cleaning, & garment services (17%) Grocery stores (16%) Misc. food prep. & kindred products (16%)** |
Inhalation of caustic, noxious, or allergenic substances (17%) Struck against stationary object (16%) |
| Arizona | 592 | 2 | Eating and drinking places (71%) | Struck by object (37%) Fall on same level (19%) |
| Arkansas | 238 | 6 | Eating and drinking places (40%) Grocery stores (13%) |
Fall on same level to floor, walkway, etc. (26%) Overexertion in lifting (16%) Contact with hot objects or substances (11%) |
| California | 1,418 | 2 | Eating and drinking places (30%) Social services (24%)†† |
Contact with hot objects or substances (21%) Bodily reaction and exertion, unspecified (13%) Bodily reaction (12%) |
| Connecticut | 220 | 4 | Grocery stores (33%) Eating and drinking places (28%) |
Fall on same level (24%) Overexertion in lifting (11%) |
| Delaware | 39 | 5 | Eating and drinking places (46%) | Fall on same level to floor, walkway, etc. (20%) Overexertion in lifting (14%) |
| Florida | 1,527 | 3 | Eating and drinking places (34%) Grocery stores (23%) Misc. amusement & rec. services (13%)‡‡ |
Fall on same level (27%) Overexertion (18%) Struck against object (12%) |
| Georgia | 499 | 3 | Eating and drinking places (42%) Grocery stores (16%) |
Fall on same level to floor, walkway, etc. (30%) Contact with hot objects or substances (16%) |
| Hawaii | 141 | 4 | Construction-special trade contractors (22%)§§ | Contact with hot objects or substances (33%) Overexertion (21%) Slip, trip, loss of balance—without fall (10%) |
| Indiana | 706 | 3 | Eating and drinking places (45%) Food stores (15%) Health services (14%) |
Fall on same level (25%) Overexertion (18%) Contact with hot objects (16%) |
| Iowa | 340 | 3 | Eating and drinking places (47%) Grocery stores (13%) Nursing & personal care facilities (10%) |
Struck by falling object (23%) Slip, trip, loss of balance—without fall (13%) |
| Kansas | 225 | 3 | Eating and drinking places (53%) | Overexertion (19%) Struck against stationary object (11%) Fall on same level to floor, walkway, etc. (10%) |
| Kentucky | 490 | 3 | Eating and drinking places (54%) | Fall on same level to floor, walkway, etc. (25%) Contact with hot objects or substances (15%) Overexertion (10%) |
| Louisiana | 175 | 4 | Grocery stores (37%) | Fall on same level to floor, walkway, etc. (23%) Overexertion in lifting (23%) Struck by falling object (16%) |
| Maine | 93 | 4 | Grocery stores (37%) | Overexertion in lifting (30%) Struck against stationary object (16%) Caught in running equipment or machinery (12%) |
| Maryland | 425 | 2 | Eating and drinking places (50%) | Struck against object (24%) Struck by falling object (20%) Fall on same level to floor, walkway, etc. (17%) |
| Massachusetts | 519 | 4 | Eating and drinking places (32%) Grocery stores (22%) Department stores (10%) |
Overexertion in lifting (20%) Struck by slipping handheld object (10%) |
| Michigan | 544 | 4 | Department stores (14%) Grocery stores (10%) |
Struck against stationary object (25%) Overexertion (13%) Fall on same level (11%) |
| Minnesota | 336 | 4 | Grocery stores (19%) Nursing & personal care facilities (11%) |
Fall on same level (11%) |
| Mississippi |
227 | 3 | Eating and drinking places (43%) Grocery stores (16%) |
Contact with hot objects or substances (18%) Fall on same level to floor, walkway, etc. (15%) Struck by slipping handheld object (14%) |
| Missouri | 615 | 5 | Eating and drinking places (53%) Grocery stores (12%) |
Fall on same level (21%) Struck against stationary object (17%) Slip, trip, loss of balance—without fall (11%) |
| Montana | 84 | 4 | General merchandise stores (12%) | Skin contact with caustic, noxious, or allergenic substances (22%) Slip, trip, loss of balance—without fall (13%) Overexertion in pulling or pushing objects (12%) |
| Nebraska | 440 | 1 | Wholesale groceries & related products (10%) | Struck by falling object (65%) Exposure to caustic, noxious, or allergenic substances (11%) |
| Nevada | 159 | 5 | Eating and drinking places (27%) Hotels and motels (31%) Misc. amusement & rec. services (12%)‡‡ |
Inhalation of caustic, noxious, or allergenic substances (23%) Fall on same level to floor, walkway, etc. (19%) Slip, trip, loss of balance—without fall (12%) |
| New Jersey | 248 | 3 | Grocery stores (27%) | Fall on same level (28%) Overexertion in lifting (16%) Caught in running equipment or machinery (13%) |
| New Mexico | 231 | 2 | Eating and drinking places (58%) Grocery stores (18%) |
Skin contact with caustic, noxious, or allergenic substances (20%) Overexertion not elsewhere classified (18%) Fall on same level to floor, walkway, etc. (14%) |
| New York | 1,060 | 6 | Eating and drinking places (34%) Grocery stores (32%) Hospitals (10%) |
Caught in or compressed by equipment or object (15%) Contact with hot objects or substances (13%) Fall on same level (13%) |
| North Carolina | 947 | 3 | Eating and drinking places (51%) Grocery stores (11%) |
Fall on same level (29%) Struck against stationary object (13%) Overexertion in lifting (10%) |
| Oklahoma | 383 | 4 | Eating and drinking places (60%) Grocery stores (13%) |
Fall on same level to floor, walkway, etc. (22%) Contact with hot objects or substances (20%) Overexertion in lifting (14%) |
| Oregon | 410 | 2 | Eating and drinking places (57%) | Struck by slipping handheld object (30%) Struck against object (19%) Slip, trip, loss of balance—without fall (10%) |
| Pennsylvania | 719 | 3 | Eating and drinking places (27%) Grocery stores (16%) |
Fall on same level to floor, walkway, etc. (25%) Overexertion in lifting (13%) Struck by slipping handheld object (10%) |
| Rhode Island | 158 | 2 | Eating and drinking places (53%) | Fall on same level to floor, walkway, etc. (31%) Contact with hot objects or substances (24%) Struck by swinging or slipping objects (16%) |
| South Carolina | 234 | 2 | Grocery stores (29%) Misc. amusement & rec. services (15%)‡‡ |
Fall on same level to floor, walkway, etc. (21%) Overexertion in lifting (11%) Struck by swinging or slipping objects (10%) |
| Tennessee | 859 | 4 | Eating and drinking places (62%) | Fall on same level (23%) Contact with hot objects or substances (22%) Overexertion in lifting (16%) |
| Texas | 992 | 3 | Eating and drinking places (46%) Grocery stores (19%) |
Fall on same level to floor, walkway, etc. (21%) Overexertion (21%) Struck by slipping handheld object (11%) |
| Utah | 303 | 3 | Grocery stores (14%) Hotels and motels (11%) |
Fall on same level (29%) Struck against stationary object (12%) Contact with hot objects or substances (11%) |
| Vermont | 24 | 1 | Hotels and motels (27%) | Fall on same level to floor, walkway, etc. (27%) Exposure to sun (22%) Struck by slipping handheld object (21%) |
| Virginia | 686 | 3 | Eating and drinking places (39%) | Overexertion (28%) Struck by falling object (14%) Fall on same level to floor, walkway, etc. (11%) |
| Washington | 361 | 2 | Eating and drinking places (62%) Grocery stores (17%) |
Struck against object (27%) Fall on same level (21%) Overexertion in lifting (17%) |
| Wisconsin | 435 | 4 | Eating and drinking places (37%) | Fall on same level to floor, walkway, etc. (18%) Overexertion in lifting (14%) Contact with hot objects or substances (13%) |
| Wyoming | 43 | 6 | General merchandise stores (17%) | Fall through roof surface (28%) Contact with hot objects or substances (14%) Skin contact with caustic, noxious, or allergenic substances (14%) |
|
*Data are from the Survey of Occupational Injuries and Illnesses, Bureau of Labor Statistics, U.S. Department of Labor. †Data are not available from Colorado, the District of Columbia, Idaho, Illinois, New Hampshire, North Dakota, Ohio, South Dakota, and West Virginia because the samples in these States were not designed to generate State specific estimates. ‡Office of Management and Budget. Standard Industrial Classification Manual 1987. Washington DC: U.S. Government Printing Office, 1982. This is a hierarchical coding structure; both specific and collapsed codes are presented in the table, depending on the available data for each State. Top three industries accounting for at least 10% each of cases are reported. §Bureau of Labor Statistics. Occupational Injury and Illness Classification Structures 1992: Code Descriptions. Washington, DC: U.S. Department of Labor. This is a hierarchical coding structure; both specific and collapsed codes are presented in the table, depending on the available data for each State. Top three events accounting for at least 10% each of cases are reported. **Includes the manufacture of the following products: canned and cured fish and seafood; prepared fresh or frozen fish and seafood; roasted coffee; potato chips, corn chips, and similar snacks; manufactured ice; macaroni, spaghetti, vermicelli, and noodles. ††Includes establishments providing social services and rehabilitation services to those persons with social or personal problems requiring special services and to the handicapped and the disadvantaged, including job training and vocational rehabilitation services. ‡‡Includes the following services: physical fitness facilities; public golf courses; coin-operated amusement devices; amusement parks; membership sports and recreation clubs etc. §§Includes special trade contractors who undertake activities of a type that are specialized either to building construction, or to both building and nonbuilding projects. These activities include painting, electrical work, carpentry work, plumbing, heating, air-conditioning, roofing, and sheet metal work. | ||||
Many state-specific studies duplicate the findings of national level studies. Numerous studies have demonstrated that the number of work-related injuries increases with age through adolescence, with the greatest incidence among workers aged 17 [Brooks and Davis 1996; Cooper and Rothstein 1995; Toscano and Windau 1995; Miller 1995; Layne et al. 1994; Castillo et al. 1994; Belville et al. 1993; Brooks et al. 1993; Banco et al. 1992; Heyer et al. 1992; Suruda and Halperin 1991; Schober et al. 1988; State of Wyoming 1984]. With one exception [Parker et al. 1994b], studies calculating injury rates by individual year of age have found increasing rates with age through adolescence [Layne et al. 1994; Belville et al. 1993; Brooks et al. 1993; State of Wyoming 1984]. Males consistently experience greater numbers and rates of injury [CDC 1996b; Brooks and Davis 1996; Cooper and Rothstein 1995; Miller 1995; Parker et al. 1994a; Layne et al. 1994; Castillo et al. 1994; Parker et al. 1994b; Belville et al. 1993; Brooks et al. 1993; Dunn and Runyan 1993; Banco et al. 1992; Suruda and Halperin 1991; Schober et al. 1988]. Many studies indicate that retail trades have large numbers and relatively high rates of injury among workers under age 18 [CDC 1996b; Brooks and Davis 1996; NIOSH 1995; Miller 1995; Layne et al. 1994; Castillo et al. 1994; Bush and Baker 1994; Belville et al. 1993; Banco et al. 1992; Schober et al. 1988; State of Wyoming 1984]. Lacerations, sprains and strains, contusions, and burns are among the most common nonfatal injuries in young workers [CDC 1996b; Brooks and Davis 1996; Miller 1995; Parker et al. 1994a; Layne et al. 1994; Parker et al. 1994b; Bush and Baker 1994; Belville et al. 1993; Brooks et al. 1993; Banco et al. 1992; Schober et al. 1988; State of Wyoming 1984].
Adolescent sprains and strains to the back are of particular concern. In Minnesota, 73% of all sprains and strains were to the low and mid back [Parker et al. 1994a]. In these analyses, sprains and strains were the most common cause of severe occupational injury, and 39% of severe injuries (61 of 157) were to the back. Of the severe back injuries, 21% (13 of 61) were to the lumbar disc. Back sprains and strains accounted for 15% of all workers compensated injuries among adolescents in Massachusetts [Brooks and Davis 1996]. Back pain is atypical in adolescence [Kelsey and Golden 1987], and first episodes of back pain are unusual before age 20. A history of back pain has been identified as a risk factor for new back injuries in two studies [Mitchell et al. 1994; Venning et al. 1987].
State-specific analyses are important for illustrating the magnitude of the problem in each State and targeting prevention efforts. Some States report considerable numbers and rates of injury for young workers in industries not otherwise prominent in the national statistics. Examples are manufacturing and construction in Massachusetts, Washington, and New York; public administration in Washington and Connecticut; and agriculture in Washington and New York [Brooks and Davis 1996; Miller 1995; Belville et al. 1993; Banco et al. 1992].
State-specific research holds potential beyond developing an industry profile of adolescent work injuries in each State. For example, analysis by residence in Massachusetts indicated that rates were highest in the southeast region of the State [Brooks and Davis 1996]. This area was selected for an innovative, community-based intervention (supported by NIOSH) to enhance young workers occupational safety and health [Child Labor Coalition 1995]. Because findings indicated that more than one-third of lacerations in Connecticut were associated with the use of case cutters, researchers suggested prevention strategies targeted at this instrument [Banco et al. 1992]. State-specific analyses have also provided unique findings not available from other studies. For example, survey data in Minnesota suggested that back injuries were more common in smaller workers and were positively associated with the amount of weight lifted [Parker et al. 1994a]. Investigations of burn events in Colorado and Minnesota and analysis of survey data led to recommendations for preventing serious burn injuries in restaurants, which are common among adolescents [Heinzman et al. 1993].
Data gathered on both the national and State levels document that occupational injuries among adolescents are frequent and severe and that better efforts are needed to protect working children. The data can also be used to target prevention efforts. The statistics are still incomplete, however.
Gaps in Surveillance Systems
Existing surveillance systems contain significant gaps. A very conservative estimate is that 11% of working youths are not represented by the SOII [CDC 1996b]. In addition, estimates from the SOII exclude injuries and illnesses not resulting in days away from work. Because children under age 18 frequently work part time, some injuries and illnesses may require limitations in activity that are not reflected in time away from work because the limitations coincide with normal days off from work. Work-related injuries treated outside emergency departments (estimated to be about two-thirds of work injuries) are not captured in the NEISS [Layne et al. 1994]. Although the intent of workers compensation is to provide coverage for all workers, no State laws cover all forms of employment [U.S. Chamber of Commerce 1991]. Groups of workers who frequently are not covered under workers compensation laws include employees in small businesses, farm laborers, domestic servants, and casual employees. Evidence also indicates that adolescents are less likely than adults to have their injuries documented in workers compensation systems [Brooks and Davis 1996].
Unreliable Identification of Work-Relatedness
Surveillance systems depend on the reliable identification of work-relatedness. Coroners, medical examiners, and health care providers may not consider work relatedness in cases involving children. Work-relatedness may also be difficult to identify in informal employment situations such as family farming or family fishing operations. Identifying work-related injuries and illnesses is particularly difficult among migrant workers who travel from area to area and may not seek medical treatment or report injuries and illnesses to their employers. In addition, data systems do not include injuries to nonworking children that result from exposure to a hazardous work environment. Family farms, farms employing migrant laborers and their families, and sweatshops in the needle trades are only three examples of situations in which young children are routinely exposed to hazardous work environments.
Inadequate Documentation of Agricultural Injuries in Children
Agricultural injuries in children are not well documented in standard occupational injury surveillance systems. Yet in 1995, an estimated 132,000 children aged 16 and 17 were employed in agriculture [BLS 1996], an industry that consistently ranks among the most dangerous in the United States [NIOSH 1993]. In 1991, an estimated 923,000 children under age 15 resided on farms and ranches [Dacquel and Dahmann 1993]. Farm children are exposed daily to agricultural hazards and may be involved in work. Children of hired farm workers who do not live on farms may accompany their parents to work [National Committee for Childhood Agricultural Injury Prevention 1996]. Because of the unique characteristics of agricultural work, surveillance of and research into childhood agricultural injuries require unique methods. Most of the data on agricultural injuries in children are aged, and new surveillance must be implemented [Stallones and Gunderson 1994].
Occupational Illnesses in Young Workers
Most information about the health outcomes of youth employment deals with injuries, but illness may also result when children and adolescents are exposed to hazardous materials or working conditions. Youths may be exposed to pesticides during farm work or lawn care, benzene during work at gasoline stations, lead during auto body repair, asbestos and silica during construction and maintenance work, and loud noise during manufacturing, construction, and farm work [Committee on Environmental Health 1995; Pollack et al. 1990; NIOSH 1994; Broste et al. 1989]. For example, audiometric threshold testing of vocational agriculture students in Wisconsin revealed that 57% of students who lived and worked on a farm had noise-induced hearing loss compared with 33% of students having little or no farm exposure [Broste et al. 1989]. Exposures to hazardous materials and working conditions may result in immediate illness or illness that is not detected for months or years after exposure. In both cases, the association with work exposures may not be recognized.
Inadequate Knowledge about the Relative Risks of Jobs
The relative risks of different jobs and information about outcomes need to be clarified. Although the risk of injury has been assessed for industry groups, it has not been assessed for various types of work or machines. Such data could inform decisions about what is appropriate work for children.
Lack of Data on the Number and Cost of Disabling Injuries
Analysis of workers compensation data in New York suggested that 44% of the compensated adolescents suffered permanent disability [Belville et al. 1993]. The number of working children and adolescents who sustain disabling injuries and illnesses, and the impact of these outcomes on their future productivity need to be quantified for the Nation and for individual States. The costs of work injuries and illnesses among youths and the payers of these costs need to be identified to understand the true extent of the problem.
A maxim of pediatrics states that children are not little adults. Most biological systems in the human body do not mature until about the age of 18 [National Research Council 1993]. Although adolescents are more like adults than younger children, their bodies are still growing and maturing. Many differences in anatomy, physiology, and psychology distinguish them from adults. These differences may translate into unique risk factors for occupational injuries and illnesses.
Size
Adolescents vary greatly in size. A lack of fit between machines and the physical dimensions and strength of children and adolescents may increase the risk for injury. For example, studies conducted by the Consumer Product Safety Commission found that certain ages, heights, and weights were associated with higher rates of injury during the use of ride-on mowers [CPSC 1993]:
The association of ride on mower injuries with small body size raises concerns about the operation of ride on mowers and other machinery by children aged 14 and 15. Growth charts suggest that more than 50% of girls aged 15 and 50% of boys aged 15 weigh less than 125 lb. Height is a smaller issue, since only 10% of girls aged 15 and less than 5% of boys fall below 60 in. [NCHS 1976].
Growth
Among military recruits in Israel, data demonstrated a decreased risk for stress fractures with each year of age above 17 [Milgrom et al. 1994]. These results suggest that adolescent bones may not have reached full structural maturity. Adolescence is characterized by a rapid growth rate, which is exceeded only by the growth rates during infancy and early childhood [National Research Council 1993]. Diminished coordination during periods of rapid growth could increase the risk for
work injury.
Sleep Requirements
Sleep research has shown that the transition from the childhood to the adult sleep-wake cycle includes several distinct steps and requires several years to complete. The adult pattern of afternoon sleepiness is first seen in children about halfway through puberty [Carskadon et al. 1980]. Yet the adult pattern of a reduced need for sleep (8 hr per night) is not observed until sometime after age 18. Current laboratory research suggests that adolescents through age 18 (and perhaps older) require approximately 9 hr of sleep per night [Carskadon 1990]. However, cross sectional surveys report an average of 7 hr of sleep per night for high school students with part-time jobs -- particularly among juniors and seniors working 20 to 30 hr per week [Carskadon 1989, 1990]. These data corroborate observations from high school teachers who report sleepy students, especially during early morning classes. Heavy part-time work schedules may result in inadequate sleep, fatigue, and increased risks for injuries while working or commuting.
Sleep research is rapidly unraveling a complex set of phenomena. The current indications are as follows:
Susceptibility to Injuries and Illnesses
Body weight, surface area, and fat composition vary between younger and older adolescents [National Research Council 1993]. These physiological differences may result in different degrees of susceptibility to occupational exposures during different periods of adolescence.
Growth and maturation are not constant across organ systems [National Research Council 1993]. The thymus grows most rapidly, exceeding adult size during most of childhood and decreasing to adult size beginning at about age 13. The brain approaches full adult size at about age 4, though behavioral development occurs through adolescence. The kidneys, spleen, and ovaries all grow steadily from about 40% of adult organ weight at age 8 to 100% at age 17. The testes and uterus increase dramatically from about 10% of adult weight at age 8 to 100% at age 17. Damage to an immature organ or organ system may permanently prevent normal physical maturation, and organ systems may be more susceptible during rapid periods of growth [National Research Council 1993]. For example, atomic bomb survivors have demonstrated increased risk for breast cancer among those exposed under the age of 20 compared with those exposed at age 40 or after [Merke and Miller 1992].
Psychological Factors
In addition to the physical and physiological changes noted above, children experience profound psychological changes as they mature. This psychological transition is often less visible than the physical one, requires more time to complete, and typically lags behind physical maturation. Thus psychological immaturity may be obscured by a relatively mature physical appearance in an adolescent. As a result, a young worker may be assigned to a task for which he or she is emotionally or cognitively unprepared. In addition, a young worker will not have adequate experience to judge his or her ability to complete an assignment safely.
The terms most often used to describe the psychological attributes of adolescence are poor judgment, sensation seeking, poor risk assessment, vulnerability to peer pressure, incomplete self-image, pressure to excel, need to prove independence and maturity, desire to conform, and (conversely) need to rebel. Although these attributes are relevant throughout the life span, adolescence is the time when the individual first encounters the possibility of making independent, adult decisions and experiencing adult consequences. Poor risk assessment combined with a tendency toward sensation seeking may lead to feelings of invulnerability while operating a motor vehicle. The natural desire to prove ones independence and skills as well as to help the family may cause a young adolescent to take on a task for which he or she is not equipped. Such impulses have often resulted in deaths and permanent injuries to children in tractor rollovers, grain bin entrapments, and equipment entanglements while working on the family farm. At least in agriculture, concerns about cognitive and emotional maturity as well as overall lack of experience have been added to the ergonomic concerns about young workers noted earlier [Aherin and Todd 1989; National Committee for Childhood Agricultural Injury Prevention 1996].
The literature about adolescent development and risk taking centers on sexual behavior, the use of alcohol and other drugs, and the operation of motor vehicles -- particularly in conjunction with the consumption of alcohol [e.g., Kidd and Holton 1993]. Sensation seeking has recently been shown to be a fairly complex (and even protective) phenomenon when examined in a context such as school sports [Smith et al. 1992]. However, the consequences of risky behaviors during adolescence are generally severe [e.g.,Zuckerman and Duby 1985]. Two studies are currently under way to shed further light on risk taking behavior in adolescence: the Youth Risk Behavioral Surveillance System conducted by the National Center for Chronic Disease Prevention and Health Promotion, and the Adolescent Health Study conducted by the University of North Carolina. Neither study emphasizes occupational issues.
Lack of Work Experience
No easy method exists for summarizing the complex issues of psychological development during adolescence and the potential consequences for working adolescents. However, lack of work experience is a contributing factor in all of the issues examined above. Additional research is necessary to confirm this hypothesis, but this brief review indicates that general lack of work experience coupled with normal adolescent psychological development places adolescents at high risk of injury on the job.
Lack of Training and Supervision
Factors related to work organization -- such as the amount of safety training and supervision -- may increase the risk for work injuries and illnesses among children and adolescents. In a telephone survey of workers aged 14 to 16 with work injuries identified through the NEISS, 54% reported receiving no training in methods to prevent their injuries [Knight et al. 1995]. Classroom discussions with 180 students in California also found low levels of training about job safety [Bush and Baker 1994]. In the NEISS telephone survey, a supervisor was present at the time of injury in only about 20% of the cases [Knight et al. 1995]. To counteract the lack of work experience, work-related training and supervision for adolescents must be both developmentally appropriate to the task and sufficient to achieve mastery. Only when teens adequately appreciate their risks on the job will they begin to adopt self-directed, self-monitored, safe work practices.
Inappropriate Work Assignments
Inappropriate work assignments also contribute to deaths and injuries of young workers. In the NEISS telephone survey, 19% of the respondents appeared to have been injured in jobs typically prohibited by Federal child labor laws for workers of their age [Knight et al. 1995]. Studies of work-related fatalities among minors have found that 38% to 86% of such fatalities occurred during work typically prohibited under Federal child labor laws [NIOSH 1995]. And as discussed earlier, 70% of the deaths of children investigated by OSHA involved safety violations [Suruda and Halperin 1991].
Children and adolescents are not little adults. In addition to physical differences, young workers have differences in psychology, cognitive abilities, and skills. A recent report about preventing childhood agricultural injuries called for developmentally appropriate guidelines for children's agricultural work based on research findings, theories, and principles associated with psychological and physical development [National Committee for Childhood Agricultural Injury Prevention 1996]. The need for age appropriate or developmentally appropriate standards for adolescent work applies to nonagricultural work as well.
Research on the psychosocial effects of adolescent employment has focused primarily on part-time work during high school. Although some adolescents drop out of high school to work full time and many high school students work full time over summer breaks, the primary interest of researchers in adolescent development has been on work during the school term. The main issues raised by this research [e.g., Steinberg and Cauffman 1995] have been the many positive and negative consequences of part-time work in the context of secondary education, extracurricular activities, family, peer group activities, and work experience relevant to future jobs.
The context of discussions about occupational safety and health in adolescent workers is somewhat broader than for adult workers. Adolescent work experience has the potential for exerting an important influence on the continuum of education and training in which adolescents participate. The task is to encourage young workers to learn positive work values (including how to work safely) while fully protecting them from workplace hazards and organizational stressors.
Some of the positive effects that have been cited for part-time work for adolescents (e.g., by Finch et al. [1997]) include the acquisition of basic work skills such as those needed to gain and keep a job and those needed to interact with coworkers, supervisors, and customers, (promptness, dependability, etc.). Longer term career enhancement may accrue as well, but these effects are not well demonstrated and remain equivocal. Similarly, development of a personal identity as a worker as well as a high school student may enhance self-confidence and self-esteem.
As work-based learning programs become more widespread, specific connections between education and work-related training may become more apparent and may enhance the overall educational experience of both school and work. Meanwhile, it is probably more accurate to conclude that although some work experiences benefit the educational performance of some high school students, these benefits are not yet known to occur in a widespread or systematic fashion.
Some adolescents undoubtedly supplement limited family resources with their pay, but data suggest that most working adolescents use their wages for personal expenses and savings. Similarly some scholars reason that adolescents who are working cannot be involved in certain delinquent behaviors. Again, the evidence for these conclusions is equivocal.
The two most salient and best documented negative effects of part-time work for some high school students are decreased school performance and increased use of alcohol. Decreased school performance has taken the form of declining grades and selection of classes that make few demands on the student. Substance abuse is not confined to alcohol, but increased alcohol use is the effect most clearly linked to part-time work during the school term, primarily because of the increased financial resources of working adolescents.
Other negative effects of part-time work include decreased participation in sports and other extracurricular activities and (as noted above earlier) a pattern of sleep deprivation that appears to be linked to the number of hours worked per week. In addition, student focus groups have identified harassment and fear of workplace violence as specific concerns of working adolescents [Duran and Miara 1995].
In summary, part-time work during the school term has both positive and negative outcomes for adolescent workers. The pattern of these outcomes and the net benefit or harm derived depends on the ability to schedule adolescent activities and achieve a balance that allows adequate time for school, sleep, and interaction with peers and family.
Promoting the safe and healthful employment of children and adolescents requires health education efforts at the community level. Such an approach is appropriate when (1) a large population is at risk, (2) a large number of people and organizations within a community may have an impact on the problem, and (3) the community lacks information and skills to deal with the health problem. All three criteria are satisfied in the area of safety and health for young workers [Bush and Baker 1994]. Although limited impacts are often reported for health education efforts at the community level [COMMIT Research Group 1995; Luepker et al. 1994; Fortmann et al. 1993], these efforts indicate that the method should be refined, not abandoned [Susser 1995].
Using Community Groups
To maintain the safety and well-being of children and adolescents while they are at work, it is necessary to provide education and training in occupational safety and health to the primary stakeholders children and adolescents as well as to their parents and employers (e.g., managers and frontline supervisors). One approach to providing occupational safety and health training is to use community groups such as the parent-teacher associations, chambers of commerce, Kiwanis, 4H, Scouts, and FFA. These groups can provide information to the primary stakeholders and thereby foster awareness and recognition of the following:
Reaching Industry and Labor Groups
Another approach to disseminating safety and health information is to use outreach programs directed to primary stakeholders. Industry and labor groups need to be aware of specific concerns for young workers and prevention strategies that work. Violations of child labor laws are common and too frequently result in serious injury or death [Knight et al. 1995; Castillo et al. 1994; Dunn and Runyan 1993; Suruda and Halperin 1991; GAO 1990, 1991]. A survey of injured adolescents indicated that 54% had not received training in prevention of their injury, and only 20% had a supervisor present at the time of the injury [Knight et al. 1995]. Employers need to know and comply with child labor laws, provide a safe and healthful work environment, ensure that adolescents recognize hazards and are competent in safe work practices, and provide appropriate supervision. Occupational safety and health information must be communicated not only to owners and managers but also to frontline supervisors who deal directly with young workers on a daily basis.
Tapping into the Educational System
Educators—Educators play a role in the occupational safety and health of children and adolescents by approving work permits, preparing students for the world of work, and providing or facilitating work experience. School staff who sign work permits should be familiar with child labor laws and not sign off on work that is prohibited for minors.
Vocational education programs—Vocational education courses are included in many secondary schools to provide students with marketable job skills. Vocational education courses are more commonly taken by students with disabilities (both physical and psychosocial) than by students without disabilities [Blackorby 1993]. An estimated 99% of students with disabilities took at least one vocational course in high school, and students with learning disabilities were most likely to take four or more related vocational courses [Wagner and Blackorby 1996]. Vocational education is considered a successful intervention for students with disabilities, as it is strongly associated with subsequent employment and higher earnings [Terman et al. 1996]. A safe and healthful environment for developing vocational skills along with knowledge and skills in safe work practices should be (but is not always) an integral component of vocational education programs. State departments of education were surveyed regarding required occupational safety and health education in high school agriculture classes [Ehlers 1992]. Of the 43 respondents, 14% had requirements in eye safety only, and 19% had no requirements. Serious injuries associated with vocational training classes have been reported to the Massachusetts Occupational Safety and Health Program [Massachusetts SENSOR Program 1993, 1995]. A case investigated by the Massachusetts program involved a student who lost his right arm and part of his scalp while working on a lathe at school [Massachusetts SENSOR Program 1995]. NIOSH researchers recently took part in an industrial hygiene survey of a vocational school and found unsafe conditions, including exposure to high noise levels and hazardous dusts and metals [Fajen et al. 1996].
School-to-work initiative—In May 1994, President Clinton signed into law the School-to-Work Opportunities Act (Public Law 103239). This and other work based learning initiatives aim to prepare students for the world of work by providing integrated school and work based instruction in all aspects of the industry. The Act intends to provide this instruction to all students, not just to those who are in vocational programs or do not plan to go to college. Occupational safety and health is included in the definition of all aspects of the industry. The school-to-work initiative holds tremendous potential for providing our future workforce with knowledge and skills in hazard recognition and remediation, safe work practices, and workers rights and responsibilities. Since this initiative will increase exposure of young people to work and work environments, it is paramount that these work experiences not threaten the safety and health of our youths. Experts in occupational safety and health need to pursue involvement in school-to-work programs to ensure that we produce a future workforce skilled in occupational safety and health and free of the specter of increased injuries resulting from increased exposures.
Health education in schools—Education in occupational safety and health also dovetails with comprehensive school health efforts. Comprehensive school health comprises eight interrelated components, including health education, a healthy school environment, staff health promotion, and parent and community involvement [Allensworth and Kolbe 1987]. The rationale for including health education in the school environment is that many unhealthy behaviors that result in substantial morbidity and mortality begin in youth. Work is a reality for many students, and most students will work at some point in their adult lives. The workplace frequently poses serious hazards to safety and health. Education in the ability to recognize and control hazards should be considered a critical life skill and incorporated into the educational system. Researchers in California used interviews, discussion sessions, and focus groups to solicit views from high school teachers about educational needs and opportunities [Bush and Baker 1994]. All the instructors agreed that students needed to be educated in workplace safety and health and that schools were an appropriate place for this education.
The numerous secondary stakeholders (e.g., child safety advocates, equipment manufacturers, insurers, and policy makers) need to be made more aware of occupational safety and health issues for children and adolescents. Childhood injury prevention advocates and professionals often fail to recognize that workplace hazards pose injury threats to children and adolescents. Information about workplace hazards could be incorporated into their prevention and research activities. Medical providers who sign work permits need to know child labor laws and ensure that they do not sign off on work that is prohibited for minors. Medical providers can also take work histories to assess the role of work in injuries and illnesses of children and adolescents; in addition, they can deliver preventive messages about workplace hazards during routine visits. Manufacturers should design equipment that will protect young workers who are small or lack skills. Manufacturers should also clearly label equipment that is not appropriate for use by children and adolescents. Insurers may be able to provide financial incentives to employers who provide job safety training to young workers and exclude them from prohibited activities. In addition to providing jobs for out-of-school and disadvantaged youths, job programs should work to provide the knowledge and skills that will keep young workers safe and healthy. Policy makers require state-of-the-art knowledge about occupational safety and health issues to inform their decisions about workforce development and child labor regulations.