|
QuickStats: Percentage of Asian Adults* Who Reported Moderate
or Heavier Drinking,† by Asian Subpopulation --- National Health
Interview Survey, United States, 2004--2006§
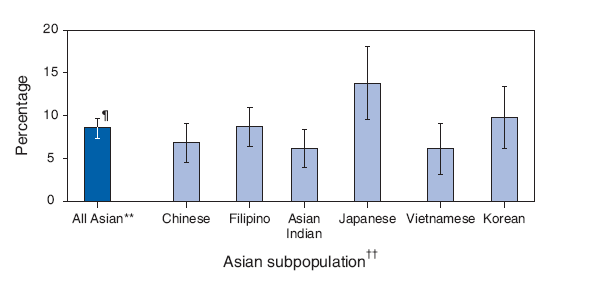
* Non-Hispanic Asians aged >18 years.
† Respondents who had at least 12 drinks in their lifetime and more than three drinks per week, up to 14 drinks
per week (on average) for men, and more than three drinks per week up to seven drinks per week (on average)
for women were moderate drinkers. Adults who had at least 12 drinks in their lifetime and more than 14 drinks per
week (on average) for men and more than seven drinks per week (on average) for women were heavier drinkers.
§ Estimates are age adjusted using the projected 2000 U.S. population as the standard population and using
four age groups: 18--24 years, 25--44 years, 45--64 years, and
>65 years. Estimates are based on household
interviews of a sample of the civilian, noninstitutionalized U.S. population and are derived from the National Health
Interview Survey sample adult component. Data were combined from three years of surveys to increase reliability of
estimates in smaller subpopulations.
¶ 95% confidence interval.
** Includes Chinese, Filipino, Asian Indian, Japanese, Vietnamese, and Korean subpopulations; also includes
Other Asian and Native Hawaiian or Other Pacific Islander subpopulations, which are not shown separately because
of small sample sizes.
†† Among persons who reported a single Asian subpopulation.
During 2004--2006, Asian adults had the lowest percentage of current moderate or heavier drinkers
(9%), when compared with whites (22%), American Indian/Alaska Natives (15%), Hispanics (13%), and
blacks (12%). However, the percentage of moderate or heavier drinkers varied substantially among
Asian subpopulations: Japanese (14%), Korean (10%), Filipino (9%), Chinese (7%), Vietnamese (6%),
and Asian Indian (6%).
SOURCE: Barnes PM, Adams PF, Powell-Griner E. Health characteristics of the Asian adult
population: United States, 2004--2006. Adv Data 2008;394. Available at
http://www.cdc.gov/nchs/data/ad/ad394.pdf.
Use of trade names and commercial sources is for identification only and does not imply endorsement by the U.S. Department of
Health and Human Services.
References to non-CDC sites on the Internet are
provided as a service to MMWR readers and do not constitute or imply
endorsement of these organizations or their programs by CDC or the U.S.
Department of Health and Human Services. CDC is not responsible for the content
of pages found at these sites. URL addresses listed in MMWR were current as of
the date of publication. |
Disclaimer
All MMWR HTML versions of articles are electronic conversions from ASCII text
into HTML. This conversion may have resulted in character translation or format errors in the HTML version.
Users should not rely on this HTML document, but are referred to the electronic PDF version and/or
the original MMWR paper copy for the official text, figures, and tables.
An original paper copy of this issue can be obtained from the Superintendent of Documents,
U.S. Government Printing Office (GPO), Washington, DC 20402-9371; telephone: (202) 512-1800.
Contact GPO for current prices.
**Questions or messages regarding errors in formatting should be addressed to
mmwrq@cdc.gov.
Date last reviewed: 4/16/2008
|
|