
Weather-Climate Connection Science
Weather is what you experience outside every day, whereas climate is a description of what happens over a given period, which can be weeks, months or years. Weather conditions over the United States are strongly affected by climate variations occurring in the tropical oceans, atmosphere, and the polar vortex. They also are influenced by changes in surface characteristics (for example, in sea surface temperatures, soil moisture, and snow cover) and storm track shifts associated with planetary-scale circulation changes.
Weather-Climate connection science is about improving NOAA's understanding and ability to predict the mutual connections of weather and climate phenomena and translating this knowledge into improved operational forecast products. There are two major aspects to this research. First, we must understand the slow climate variations (such as week-to-week shifts in the position of the jet stream the strength of the polar vortex, and the behavior of "atmospheric rivers") that affect the frequency and severity of weather systems. Second, we must use this understanding to improve the ability of the National Weather Service's (NWS) weather and climate prediction systems to forecast the risk of extreme weather events and provide better warnings to the public.
How are weather and climate connected?
There are many ways in which climate and weather are connected. The frequency and intensity of hurricanes is influenced by changes in sea-surface temperature and upper- level wind patterns in the tropical Atlantic that occur on monthly, seasonal, decadal, and longer timescales. Shifts in the position of the jet streams in mid-latitudes can affect where storms will develop. These jet-stream shifts can occur on seasonal time scales (in association with El Nino) and also on weekly times scales (associated with planetary scale meanders of the jet-stream itself, which are often related to changing conditions in the tropical atmosphere). Mid-latitude storms are steered by the jet stream and get their energy from temperature contrasts associated with it. Relatively slow variations in these global-scale properties and patterns are generally more predictable than individual weather systems.
ESRL has led the development of a major example of this type of work, that of "atmospheric rivers". Atmospheric rivers are narrow regions of the atmosphere that are a part of extratropical storms where vast quantities of water vapor are transported. Research has shown that they account for >90% of the total pole-ward water vapor transport in the midlatitudes. In addition, wherever these features strike coastal mountains for example they can lead to extreme rainfall, flooding and debris flows. In short, not only do atmospheric rivers play a crucial role in the global water budget, they can also lead to extreme precipitation and flooding, and thus represent a key phenomenon linking weather and climate.
Although winter storms are a major focus of the weather-climate connection, more "benign" weather extremes also provide forecast challenges, particularly for air quality. For example, on the U.S. west coast, the position of the subtropical high pressure zone in the summer has a major impact on ozone production as well as energy demand. Similarly, in the winter, forecasting fine particle concentrations for visibility and health effects will require concurrent improvements in forecasting snow cover and the persistence of stagnant high pressure regimes. Therefore, weather-climate connection research will improve predictions of the risk of extreme weather events at longer forecast leads than we do now.
Why is it important?
Long-term changes in global or regional weather patterns affect all aspects of our society, ranging from land use, energy use, water supply, air quality, and transportation, to overall safety and security. Extreme weather events such as floods, heat waves, and cold snaps can have devastating economic, environmental, and societal impacts. Providing warning of the enhanced risk of an extreme event allows opportunity for averting or mitigating the effects of these events, saving lives and property and mitigating economic impacts. For example, improved temperature forecasts can benefit the energy industries. Similarly, forecasts of local heavy rain in mountainous terrain and improve warnings of debris flows that lead to loss of life and property. Anticipating changes in the likelihood and intensity of extreme weather events in the context of changing climate conditions can also provide critical foundations for policy development, e.g., can we expect more intense land-falling hurricanes, severe storms and floods to affect vulnerable urban areas?
What can we predict?
Some aspects of weather extremes are predicted quite well by current operational prediction models. However, translating the output of these models into accurate and reliable estimates of the extreme event risk is an emerging area of research at NOAA's Earth System Research Laboratory. An example is the series of storms that caused extensive flooding and landslides in La Conchita area of Ventura County California in January 2005.
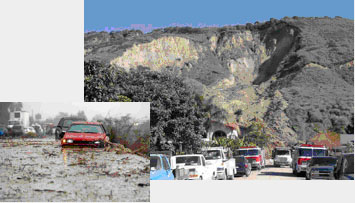
Pictures of damage done by heavy rainfall in La Conchita California during the second week of January 2005.
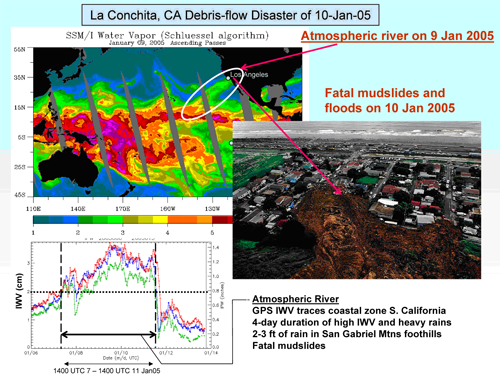
Illustration of an atmospheric river striking Southern California on January 9th, 2005, which produced up to 30 inches of rainfall in 4 days in the coastal mountains and led to a deadly debris flow pictured at right. The satellite image in the upper left shows areas of large water vapor content (green to red), while the lower left panel shows the large values of water observed by GPS receivers in the area. ESRL research has led to the identification of 2 cm of water vapor as a key threshold distinguishing atmospheric river conditions. In this event the value was almost double the threshold.
Weather models were able to predict the jet stream variations that led to the floods more than a week in advance. Techniques developed at ESRL for translating the model output into a risk of extreme precipitation were able to provide advance warning of flooding conditions.
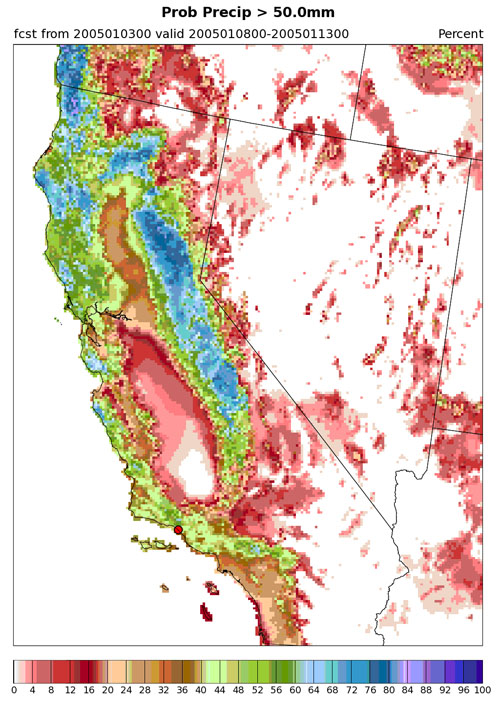
A map showing the forecast of the risk of more than 2 inches of rainfall, issued on January 3 for the 5 day period from January 8 to January 13, 2005. The location of the flooding shown in the photo is indicated by the red dot, where the forecast risk of greater than 2 inches of rain exceeds 50%. This is an experimental forecast produced developed at ESRL.
- NOAA Weather Climate Connection Research
- Experimental Precipitation Forecasts
- Improving predictions with retrospective forecasts
- NOAA Hydrometerological Testbed
- "Atmospheric Rivers" and U.S. rainfall
- Experimental MJO prediction website
- Atmospheric rivers documented over the Eastern Pacific Ocean
- The role of atmospheric rivers in flooding on California's Russian River
How can we improve predictions?
Some types of jet-stream fluctuations are not well predicted by NWS models, particularly those related to week-to-week changes in the tropical atmosphere. Better understanding of the processes in the tropical atmosphere that lead to jet-stream variations is needed so that we can improve the ability of forecast models to predict them. Determining the risk of an extreme event requires detailed knowledge of all the uncertainties in the model forecast. Improving our estimates of these uncertainties results directly in more accurate and reliable warnings. Both of these are active areas of ESRL research. One source of uncertainty is the observational information used to start a forecast model, another is in the physics of the models themselves. For example, our current global observing system does not monitor water vapor transport, which means that atmospheric rivers may appear in the models with incorrect amount of water vapor, strength of wind, or both. Similarly, the physical representation of atmospheric rivers in the global models may be inadequate due to spatial resolution limitations.
How does society benefit from this research?
Early and accurate storm warnings can save life and property on large and small scales. For example, seven of the ten most expensive hurricanes in US history occurred in the 14 months from August 2004 to October 2005, including Katrina ($40.0 billion insured losses), Rita ($4.7 billion), and Wilma ($6.1 billion). Hurricane Katrina affected the entire states of Mississippi and Louisiana, plus twenty two counties in Alabama and nine in Florida. Rita affected all of Louisiana plus twenty six counties in Texas. Research has reduced hurricane track error by a factor of 4 in 40 years, yet there still remains substantial room for improvement if we are to reduce the societal and economic impacts of severe storms. Similarly, Sacramento is protected by a dam upstream that is undersized for major floods that are the result of atmospheric rivers striking the area. Improvements in forecasts could reduce the risk of catastrophic urban flooding in this state capital, and could help address concerns in water resource management in the area that is posed by changing climate.