


Return to Previous page |
| PDF Version, Color |
National Survey of Child and Adolescent Well-Being
No. 8: Need for Early Intervention Services Among Infants and Toddlers in Child Welfare
Research Brief
Findings from the NSCAW Study
Child maltreatment has a significant negative impact on children’s development. The stress suffered by young children exposed to recurrent physical abuse, emotional abuse, or chronic neglect can lead to difficulties in learning, behavior, and physical and mental health.1 Many of these young children are candidates for early intervention services; information has been lacking on the number of maltreated infants and toddlers in need in the United States.
Similarly, we know little about how many maltreated children receive early intervention services, despite federal support for early intervention services for infants and toddlers in need. The Early Intervention Program for Infants and Toddlers (P.L. 99-457), now known as Part C of the Individuals with Disabilities Education Act (IDEA),2 was established by the federal government in 1986 “to encourage states to expand opportunities for children less than 3 years of age who would be at risk of having substantial developmental delay if they did not receive early intervention services.”3 After the child is assessed to determine the need for services, an Individualized Family Service Plan (IFSP) is developed in collaboration with the child’s caregiver. A legal document, the IFSP is written to identify goals and individualized supports and services that will enhance the child’s development. Early intervention services are most commonly provided at the child’s home and include speech/language therapy, special instruction, occupational therapy, developmental monitoring, and physical therapy. In some cases, the assessment reveals that the child is developing adequately, and the IFSP specifies that the child will be monitored and evaluated every 6 months. The IFSP is reviewed periodically, at which point both service providers and caregivers decide whether to renew it. At age 3, children who are determined to need special education services may similarly receive an Individualized Education Plan (IEP), addressed by Section 619, Part B of IDEA for children 3 to 5 years old.4
It is estimated that 2.2% of children 0–2 years old in the United States receive services under Part C.5 States have different Part C eligibility criteria, making it difficult to determine the number of children in need of early intervention services. National estimates of need for early intervention services based on parental reports of any kind of child developmental problem range from 3.2% to 23.4%.6-10
Under Part C, there are two mandated eligibility categories and one discretionary category. States must serve all children who are experiencing (1) a developmental delay (determine by developmental assessment), and (2) those that have a diagnosed mental or medical condition that has a high probability of resulting in developmental delay (e.g., chromosomal abnormalities, genetic or congenital disorders, severe sensory impairments, exposure to toxic substances). States have the choice as to whether they serve at risk children (discretionary category). In the great majority of U.S. states and territories, infants and toddlers are only eligible to receive Part C services if they are experiencing a developmental delay or have a diagnosed medical condition. Eight states and territories also choose to serve children who are at risk of developmental delay due to biomedical risks (e.g., low birth weight, failure to thrive, chronic lung disease) and/or environmental risks (e.g., parental substance abuse, poverty, parental age, child abuse, and neglect).11 As of 2003, the federal Child Abuse and Prevention Treatment Act (CAPTA) requires that infants and toddlers who are substantiated for child maltreatment be referred to Part C early intervention services.12 This critical piece of legislation was passed when children in this study were over 3 years old and, consequently, over the age to qualify for Part C early intervention services.
Little research is available to help us understand how many infants and toddlers involved in maltreatment investigations are in need of Part C services or to what extent such children have already been served under Part C and/or are later referred to special education services and have an IEP. This research brief examines the need for and provision of an IFSP during the first 3 years of life among infants and toddlers involved in investigations of child maltreatment. The brief asks the following questions:
-
What percentage of infants and toddlers involved with Child Welfare Services (CWS) need early intervention services, based on criteria that states use? What percentage receives an IFSP?
-
What child and maltreatment characteristics predict having an IFSP?
-
What percentage of infants and toddlers later has an IEP? What percentage of those who ever had an IFSP transition to an IEP?
National Sample of Cases Involving Allegations of Maltreatment
In this research brief, data from the National Survey of Child and Adolescent Well-Being (NSCAW) are used to describe the need for early intervention services and IFSP receipt among infants and toddlers involved in CWS investigations. NSCAW is a national longitudinal study of the well-being of 5,501 children ages 14 and younger who had contact with the child welfare system within a 15-month period starting October 1999.13
This research brief focuses on the 2,015 children who were infants or toddlers when they were first involved in investigations of maltreatment. The data used here were collected between 1999 and 2004 and are drawn from standardized measures of child development as well as caregiver and caseworkers interviews at baseline and at 12-, 18-, and 36-month follow-ups for all children who were under 3 at baseline in the NSCAW Child Protective Services (CPS) sample.
For the purpose of this report, the need for Part C services due to developmental delay is based on three standardized measures. The Battelle Developmental Inventory (BDI) measures cognitive skills such as perceptual discrimination, memory, reasoning, and conceptual development.14 The Preschool Language Scale-3 (PLS-3) measures sensory discrimination, memory and attention span, logical thinking, grammar, and vocabulary.15 The Daily Living Skills measure from the Vineland Adaptive Behavior Scale Screener (VABS) assesses self-help skills and the ability to complete activities of daily living (e.g., brushing teeth and using a spoon).16 Children were considered in need of Part C if they had extremely low scores on one of these tests or very low scores on two of the three.17 Consistent with the eligibility criteria of the majority of states, children were also considered in need if either caregivers or caseworkers reported an established medical condition that had a high probability of resulting in developmental delay.18
This brief also estimates the percentage of children with biomedical risk factors19 and environmental risk factors.20 It then reports the estimated percentage of children who would be considered in need of Part C services based on developmental delay or an established medical condition (criteria in most states). A separate analysis estimates the percentage who would be considered in need if biomedical and environmental risks (criteria in only a few states) were considered.
Finally, this brief reports (a) the percentage of children who received an IFSP between baseline and the 12-month follow-up, (b) the percentage who received and IFSP or an IEP between the 12- and 18-month follow-ups, and (c) the percentage who received an IEP at the 36 month follow-up (when they had “aged out” of the IFSP process). These percentages are broken out by categories of need.
The Children
Of the infants and toddlers in families assessed or investigated by CWS after a report of child abuse or neglect, 33% were age 0–1, 39% were age 1–2, and 28% were age 2–3. About half were boys and half girls. Almost half were white (46%), followed by African American (29%) and Hispanic (19%). The most serious reported forms of maltreatment were lack of supervision (32%), failure to provide (28%), and physical abuse (21%). At baseline, 16% were placed outside of their biological home (into foster or kinship care).
How Many Were in Need of Part C and Part B Services?
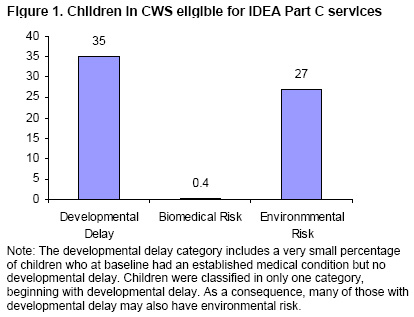
Based on the eligibility criteria used by most states, 35% of children were in need of Part C services at baseline. Thirty-four percent of children were in need due to developmental delay, 1.6% had both developmental delay and an established medical condition, and 1.4% had an established condition without yet showing signs of developmental delay. By the 18-month follow-up, 40% of children were in need of services due to developmental delay or an established medical condition. By the 36-month follow-up, when all children were over 3 years old and no longer qualified for Part C services, 41% of children were in need of Part B or special education services due to developmental delay or an established medical condition.
If the IDEA included biomedical risks and environmental risk factors as eligibility criteria, as eight states do, 63% of children would meet criteria for Part C services at baseline. Figure 1 shows need by the three criteria. Although only a few children are in need because of a biomedical risk, an additional 27% are in need due to environmental risks. The presence of child abuse or neglect itself was not counted as a criterion for environmental risk in this analysis because our aim was to better understand the role of other environmental risk factors. Other NSCAW publications present information on the percentages of children reported with different forms of maltreatment, the percentage of reports that were substantiated, and the percentage of children judged to be harmed or at risk.21
[D] |
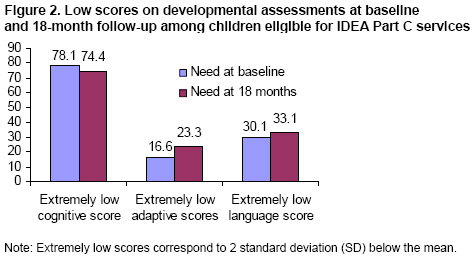
Most children under age 3 who were investigated by CWS and deemed to be in need of Part C services due to developmental delay or an established medical condition had extremely low scores on the developmental assessments.17 Figure 2 shows that, on the developmental assessments, more than 70% of children had an extremely low score on the cognitive scale, about 20% had extremely low scores on the adaptive behavior scale, and just over 30% had extremely low scores on the language scale. These proportions were similar at baseline and 18-month follow-up. Taken together, more than 90% of children in need of Part C services due to developmental delay or an established medical condition had an extremely low score on at least one of the developmental scales. The other 10% had very low scores on at least two of the developmental scales.
[D] |
There were no differences by child gender, race/ethnicity, type of maltreatment, severity of harm, severity of risk, poverty level, or placement type in the proportion of children in need of Part C services due to developmental delay or an established medical condition. Children with unsubstantiated reports22 (38%) were significantly more likely than children with substantiated reports (28%) to be in need of Part C services due to developmental delay or an established medical condition.
How Many Children Had an Individual Family Service Plan?
Among children with developmental delay (about a third of all children at any given time), 9% had an IFSP between baseline and the 12-month follow-up. At the 18-month follow-up, 12% had an IFSP and 4% had an IEP, and at the 36-month follow-up, 23% had an IEP.
Among the small proportion of children (3%) at baseline identified with an established medical condition, 40% had an IFSP between baseline and the 12-month follow-up. As children grew, more were identified as having an established medical condition. By the 18-month follow-up, 11% had been identified with an established medical condition; of those, 16% had an IFSP and 37% an IEP. At the 36-month follow-up, about 20% of children had been identified with an established medical condition; of those, 57% had an IEP.
Overall, 12% of all infants and toddlers had an IFSP between baseline and the 12-month follow-up. While fewer children at the 18-month follow-up had an IFSP (7%), a small percentage of children at that point were reported to have an IEP (4%), indicating some preliminary access to Part B services, which include school-based special education. Access to IEP services had increased further by the 36-month follow-up (11%). Of the children who had an IFSP before age3, 22% received an IEP through Part B preschool special education services after turning 3.
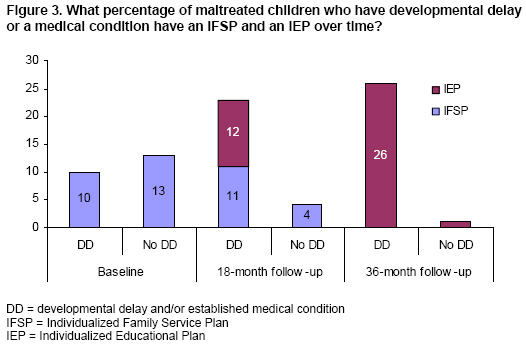
Figure 3 shows the percentage of children who had an IFSP between baseline and the 12-month follow-up and at the 18- and 36-month follow-ups, separately for those children in need due to developmental delay or an established medical condition and those without developmental delay. Ten percent of those determined to be in need due to developmental delay or an established medical condition at baseline and 13% of those without developmental delay had an IFSP between baseline and the 12-month follow-up. Thus, children with and without developmental delay did not differ significantly in receiving an IFSP at baseline.
 [D] |
At the 18-month and 36-month follow-ups, children with developmental delay or an established medical condition were more likely to have an IFSP or IEP than children without developmental delay (see Figure 3). This suggests that children with low scores on developmental measures were more likely to have a service plan developed as they grew up, even though many of those in need due to developmental delay or an established medical condition never received an IFSP or an IEP.
Although developmental delay or an established medical condition at baseline did not predict whether or not children had an IFSP between baseline and the 12-month follow-up, several other factors did. For example, significantly more children with substantiated maltreatment cases (22%) had an IFSP than those with unsubstantiated cases (8%). Children living at or below the federal poverty line (13%) were significantly more likely to receive an IFSP than those living above the poverty line (10%). Children receiving some type of CWS intervention (e.g., foster care [27%], kinship care [17%], CWS services in biological home [21%]) were more likely to have an IFSP than those living in their biological home and not receiving CWS services (5%). These findings were true even when taking into account whether or not children had developmental delay or an established medical condition.
Key Findings
-
Infants and toddlers in the child welfare system show higher rates of need for Part C early intervention services due to developmental delay or an established medical condition than do U.S. children overall.
-
Infants and toddlers in unsubstantiated cases show greater need for Part C early intervention services due to developmental delay or an established medical condition at the time of contact with CWS than do infants and toddlers in substantiated cases.
-
Although infants and toddlers in CWS investigations show higher rates of having an IFSP than U.S. children overall, many of those in need due to developmental delay or an established medical condition never received an IFSP or an IEP.
-
Developmental delay did not predict receiving an IFSP at baseline but was a strong predictor of both IFSP and IEP services at the 18- and 36-month follow-ups.
-
Infants and toddlers with substantiated cases were more likely than children in unsubstantiated cases to have an IFSP even if they did not have a developmental delay or an established medical condition. Moreover, children receiving services at their biological home from CWS and those placed in foster and kinship care were more likely to have an IFSP than children in their biological home without CWS services.
What does this mean?
The percentage of CWS-involved children found to be in need of Part C early intervention services due to developmental delay or an established medical condition (35%) is substantially higher than the percentages found for the general U.S. population (which range from 2% to 23%, depending on the study). The high percentage of CWS children with developmental problems may be in part explained by the number of risk factors faced by these infants, who suffer from child abuse or neglect, poverty, parental substance abuse, and many other family and community problems.
It should be noted that the need for Part C services described here is based on child screening assessment tools and was not part of a formal clinical evaluation. When a child is evaluated in the field for Part C eligibility, this evaluation is usually conducted with a multidisciplinary team of professionals. Some young children involved with CWS and referred to Part C will not fulfill the strict criteria of eligibility of the majority of states. On the other hand, in a few states, many children will be eligible simply on the basis of maltreatment, one of the environmental risks that are criteria for eligibility. This may help explain why presence of an IFSP was about as common among children who did not meet the developmental and medical criteria as among children who did. The maltreatment that was investigated near baseline and the high number of environmental risk factors may have triggered a referral to Part C early intervention services.
The 12% of children who had an IFSP between baseline and 12 months is higher than the 2.2% of all American infants and toddlers receiving Part C services (which follow from an IFSP).5 Although some of this difference may stem from those IFSPs that only involve monitoring, this still suggests that children in CWS have more need of and use more early intervention services than do U.S. children overall.
Most children (78%) who had ever had an IFSP did not have an IEP through Part B preschool special education services after they reached 3 years old. This is not because they outgrew their need for special education; many children continued to show indicators of service need. National estimates based on children receiving Part C services indicate that 63% of these children move on to receive Part B preschool special education services.23 Consequently, the discontinuity of early intervention and special education services for children in CWS is a cause for concern and should be the subject of future research.
Children with unsubstantiated cases of maltreatment had even higher levels of need for Part C early intervention services due to developmental delay than did those with substantiated cases of maltreatment. The reason for this difference is unclear. However, children in substantiated cases were more likely to have an IFSP, even if they did not yet show signs of developmental delay. This is consistent with findings from previous studies showing that substantiated children receive more scrutiny, services, and referrals from CWS, which act as a gateway into mental health and other service systems.24
Caseworkers may assess the number and severity of risk factors surrounding substantiated infants and toddlers and make service referrals to prevent future developmental problems, regardless of current developmental status. CWS may thus be acting as a gateway into early intervention services for some children it has contact with, but not apparently for all who need it. The degree to which CWS should play a role in service access for all children it investigates, regardless of substantiation status, is an important area for future research and policy consideration.
Young children in the child welfare system have developmental needs that require the intervention of experts in child development, infant health, mental health, and education.25 While findings from this research brief demonstrate that as children grow they are more likely to receive services, many children who were determined to be in need due to developmental delay and who likely met Part C eligibility criteria received no services. Consequently, many of the children involved with the child welfare system who could likely benefit from Part C services were not receiving them.
1 As reported by the National Scientific Council Center on the Developing Child at Harvard University, young children exposed to recurrent physical or emotional abuse or to chronic neglect are more likely to suffer toxic stress, a persistent elevation of stress hormones and key brain chemicals that disrupts the architecture of the developing brain and can lead to developmental delay. National Scientific Council Center on the Developing Child at Harvard University (2007). The science of early child development: Closing the gap between what we know and what we do. Available: www.developingchild.net.
2 IDEA. (2004). The Individuals with Disabilities Education Improvement Act of 2004, Pub. L. No. 108-446, §632, 118 Stat. 2744.
3 Shackelford, J. (2005). State and jurisdictional eligibility definitions for infants and toddlers with disabilities under IDEA.
NECTAC Notes, 18, 1-9.
4 In 1975, the Education for All Handicapped Children Act (P.L.94-142) required states and jurisdictions to provide special education services to children identified by the disability categories enumerated in the law (mental retardation, hearing impairments, speech or language impairments, visual impairments, serious emotional disturbances, orthopedic impairments, autism, traumatic brain injury, other health impairments, or specific learning disabilities), also known as Part B categories. IDEA amendments of 1991, P.L. 102-119, allowed states to incorporate an additional category for children ages 3 to 5 who are experiencing developmental delay. The amendment of 1997, P.L. 105-17, allowed states to apply the term developmental delay to children ages 3 to 9. P.L. 105-17 charges the states with defining developmental delay, the age range to which it applies, and the diagnostic instruments and procedures that will be used to determine delay. Danaher, J. (2005). Eligibility policies and practices for young children under Part B of IDEA. NECTAC Notes, 15, 1-17.
5 OSEP. (2006). 26th Annual report to Congress on the implementation of the Individuals with Disabilities Education Act, 2004, Vol. 1. Office of Special Education and Rehabilitation Services. Available: http://www.ed.gov/about/reports/annual/osep/2004/26th-vol-1-sec-1.pdf.
6Blanchard, L. T., Gurka, M. J., & Blackman, J. A. (2006). Emotional, developmental, and behavioral health of American children and their families: A report from the 2003 National Survey of Children’s Health Pediatrics, 117, 1202-1212.
7 Simpson, G. A., Colpe, L., & Greenspan, S. (2003). Measuring functional developmental delay in infants and young children: Prevalence rates from the NHIS-D. Paediatric and Perinatal Epidemiology, 17, 68-80.
8 Nolin, M. J., Montaquila, J., Nicchitta, P., Hagedorn, M. C., & Chapman, C. (2004). National Household Education Surveys Program: 2001 Methodology Report. Available: http://nces.ed.gov/pubs2005/2005071_3.pdf.
9 Zill, N., & Schoenborn, C. A. (1990). Developmental, learning, and emotional problems: Health of our nation’s children, United States 1988. Vital and Health Statistics of the National Center for Health Statistics, 190, 1-16.
10 Stevens, G. D. (2006). Gradients in the health status and developmental risks of young children: The combined influences of multiple social risk factors. Maternal and Child Health Journal, 10(2), 187-199.
11 Currently, about two-thirds of states define developmental delay based on 2 standard deviations (SD) below the mean in at least one developmental area (cognitive development, physical development, communication development, social or emotional development, or adaptive development) or 1.5 SD below the mean in at least two areas, while the other one-third defined developmental delay as 1.5 SD below the mean in one area. Only a few states and territories serve children on the basis of whether they have biomedical and environmental risk factors (Hawaii, Massachusetts, New Hampshire, California, New Mexico, West Virginia, American Samoa, and Guam).
12 CAPTA. (2003). Keeping Children and Families Safe Act of 2003. Available: http://www.acf.hhs.gov/programs/cb/laws_policies/policy/im/im0304a.pdf.
13 For more information on NSCAW methodology, see NSCAW Research Group (2002). Methodological lessons from the National Survey of Child and Adolescent Well-Being: The first three years of the USA’s first national probability sample of children and families investigated for abuse and neglect. Children and Youth Services Review, 24, 513-543; and U.S. Department of Health and Human Services, Administration for Children and Families (2005). National Survey of Child and Adolescent Well-Being (NSCAW): CPS Sample Component, Wave 1 Data Analysis Report. Washington, DC: ACF.
14 Newborg, J., Stock , J. R., & Wnek, L. (1988). Battelle Developmental Inventory. Allen, TX: Riverside Publishing.
15 Zimmerman, I. L., Steiner, V. G., & Pond, R. E. (1992). PLS-3: Preschool Language Scale-3. San Antonio, TX: The Psychological Corporation.
16 Sparrow, S. S., Balla, D. A., & Cicchetti, D. V. (1984). Vineland Adaptive Behavior Scales (VABS): American Guidance Service.
17 Extremely low scores corresponds to 2 SD below the mean; very low scores corresponds to 1.5 SD below the mean.
18 Caregiver reported one or more of the following established medical conditions that have a high probability of resulting in developmental delay, according to Part C policy: brain tumor, cerebral palsy, epilepsy, fetal alcohol syndrome, birth defects, sickle cell anemia, spina bifida, autism, deafness, visual impairment including blindness, hearing impairments, multiple disabilities, and traumatic brain injury.
19 Caregiver reported one or more of the following biomedical risk factors: AIDS, failure to thrive, lead poisoning, and low birth weight.
20 The identification of environmental risk factors is based on caseworkers’ report of one or more of the following characteristics of the primary caregiver at baseline: active alcohol or drug abuse, serious mental health problems, cognitive impairment, and physical impairments. Environmental risk is also identified if children were reported by the caseworker at baseline to be exposed to two or more of the following: caregiver age at delivery was less than 19 years old, active alcohol or drug abuse by secondary caregiver, incarceration of primary caregiver, and single caregiver.
21 See U.S. Department of Health and Human Services, Administration for Children and Families. (2005b). National Survey of Child and Adolescent Well-Being (NSCAW): CPS sample component, Wave 1 data analysis report. Washington, DC: ACF. Also see U.S. Department of Health and Human Services, Administration on Children and Families. (forthcoming). How do caseworker judgments predict substantiation of child maltreatment? Research Brief. Washington, DC: ACF.
22 Substantiation refers to Child Welfare Services’ official decision about the validity of abuse allegations. For more information on the nature of substantiation, see U.S. Department of Health and Human Services, Administration on Children and Families. Caseworker Judgment and Substantiation. Research Brief (forthcoming). Washington, DC: ACF.
23 Hebbeler, K. M., Spiker, D., Bailey, D., Scarborough, A., Mallik, S., Simeonsson, R., Singer, M., & Nelson, L. (2007). Early intervention for infants and toddlers with disabilities and their families: Participants, services and outcomes. Final report of the National Intervention Longitudinal Study (NEILS). SRI International. Available: http://www.sri.com/neils/reports.html.
24 Leslie, L. K., Hurlburt, M. S., James, S., Landverk, J., Slymen, D. J., & Zhang, J. (2005). Relationship between entry into child welfare and mental health service use. Psychiatric Services, 56(8), 981-987.
25 Shonkoff, J. P., & Phillips, D. A. (2000). From neurons to neighborhoods: the science of early child development (2nd ed.). Washington, D.C.: National Academy Press.
National Survey of Child and Adolescent Well-Being Research Brief Administration for Children and Families (ACF, OPRE) http://www.acf.hhs.gov/programs/opre/abuse_neglect/nscaw/ This is the eighth in a series of NSCAW research briefs focused on children who have come in contact with the Child Welfare System. Additional research briefs focus on the characteristics of children in foster care, the provision of services to children and their families, and the maltreatment investigation substantiation process. |
| Return to Previous page |