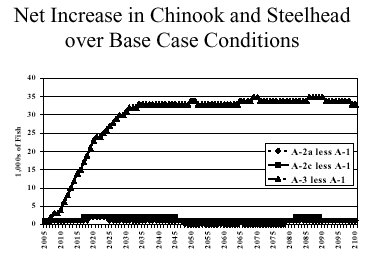
Figure 8-1. Net Increase in Fish over Base Case Conditions using 1998 PATH model results (in 1,000s of fish)
8.0 Cost Effectiveness
8.1 Introduction and Study Organization
The purpose of the cost effectiveness analysis is to identify the least cost method for providing various levels of output. For example, if two of the alternatives under consideration meet the NMFS jeopardy standards, then cost effectiveness analysis helps to establish the less costly alternative.
The following chapter reports the results of the cost effectiveness analysis. It should be noted that this report only deals with NED costs and benefits, as defined by the U.S. Army Corps of Engineers. The chapter is divided into five sections: introduction and study organization, discussion of biological outputs, discussion of net cost factors, cost effectiveness and incremental cost comparisons, and risk and uncertainty.
8.2 Discussion of Biological Outputs
There are four species of fish in the Lower Snake River system that have been listed as endangered by the NMFS under the Endangered Species Act, including spring/summer chinook, fall chinook, steelhead and sockeye. The effects of the proposed alternatives in improving the chances of recovery and survival of these species are considered the "benefits" or "output" of undertaking the study alternatives. The following section reviews the development and application of the NMFS jeopardy standards.
The PATH analysis was based upon the 6th weakest of 7 stocks of spring/summer chinook and 1 stock of fall chinook but PATH results were not extrapolated to the entire population of LSR chinook. Data was not available to provide PATH modeling for steelhead and sockeye.
The AFISH economics team, working in coordination with staff from NMFS and members of PATH, extrapolated the results of the PATH analysis to all LSR spring/summer and fall chinook stocks and also prepared estimates for steelhead, which are believed to have a similar biological response to that of spring/summer chinook. Neither PATH nor the AFISH economics team prepared estimates for sockeye, because there was insufficient data.
8.2.1 PATH Model Results
The Plan for Analyzing and Testing Hypotheses (PATH) is a formal and rigorous program of formulating and testing hypotheses by using a series of model simulations to estimate both past and future trends in fish abundance for each of the selected stocks. The primary objective of PATH’s modeling is to enhance the survival opportunities of the affected ESUs by considering the stock’s response to jeopardy standards, which were defined by the Biological Requirements Working Group (BRWG) and largely accepted by NMFS. (Source: PATH Decision Analysis Report for Snake River Fall Chinook, September 1999, Appendix I).
8.2.1.1 Definition of Jeopardy Standards
The jeopardy standards include both survival and recovery goals as defined below:
8.2.1.2 Spring/Summer Chinook 1998 Model Results
Table 8-1 presents the probability of each alternative meeting the NMFS 24-year and 100-year survival standards and the 48-year recovery standards for spring/summer chinook using data from the 1998 PATH model results as reported by NMFS. This table presents the median modeling results, which are considered the most likely outcome, as well as the 25th and 75th percentile model results, which bound the median result with a range from low to high outcomes.
|
Table 8-1 Probability of Attaining NMFS Jeopardy Standards for Spring/Summer Chinook Using Unweighted 1998 Model Results | ||||
| Action | Median | 25th Percentile | 75th Percentile | |
| 24-Year Survival | ||||
| Alternative 1 - Existing Condition Alternative 2 - Maximum Transport of Juvenile Salmon Alternative 3 - Major System Improvements Alternative 4 - Dam Breaching |
0.67 0.65 0.66 0.69 |
0.55 0.54 0.55 0.63 |
0.75 0.75 0.75 0.76 | |
| 48-Year Recovery | ||||
| Alternative 1 - Existing Condition Alternative 2 - Maximum Transport of Juvenile Salmon Alternative 3 - Major System Improvements Alternative 4 - Dam Breaching |
0.48 0.45 0.46 0.84 |
0.31 0.29 0.31 0.74 |
0.65 0.66 0.67 0.92 | |
| 100-Year Survival | ||||
| Alternative 1 - Existing Condition Alternative 2 - Maximum Transport of Juvenile Salmon Alternative 3 - Major System Improvements Alternative 4 - Dam Breaching |
0.79 0.78 0.79 0.89 |
0.68 0.65 0.67 0.85 |
0.87 0.87 0.87 0.92 | |
| Source: Personal communications from NMFS (from Lynn Krasnow, verified by Tom Cooney) | ||||
24-Year Survival Standard for Spring/Summer Chinook
None of the median results of any the alternatives under consideration meet the 24-year survival standards, which as discussed above requires a 70% probability. However, the median results of all alternatives are relatively close to the survival standard (e.g., within 1% to 5% of meeting this standard). In addition, all alternatives meet the standard under the 75th percentile model results.
48-Year Recovery Standard for Spring/Summer Chinook
Alternative 3, Dam Breaching, is the only alternative under consideration, which meets the 48-year recovery standards for the median model results. None of the median results of dam retention alternatives (e.g., alternatives 1, 2 and 3) meet the 48-year recovery standards. However, the median results of the dam retention alternatives are relatively close to meeting the standard (e.g., within 2% to 5%). In addition, the 75th percentile model results for all alternatives exceeds the recovery standard.
100-Year Survival Standard for Spring/Summer Chinook
All of the median results of the alternatives under consideration meet the 100-year survival standards, which as discussed above requires a 70% probability.
8.2.1.3 Fall Chinook Model Results
Table 8-2 presents the probability of each alternative meeting the NMFS jeopardy standards for fall chinook. This table also presents the median modeling results, which are considered the most likely outcome, as well as the 25th and 75th percentile model results, which bound the median result with a range from low to high.
|
Table 8-2 Probability of Attaining NMFS Jeopardy Standards for Fall Chinook Using Unweighted 1998 Model Results | ||||
| Action | Median | 25th Percentile | 75th Percentile | |
| 24-Year Survival | ||||
| Alternative 1 - Existing Condition Alternative 2 - Maximum Transport of Juvenile Salmon Alternative 3 - Major System Improvements Alternative 4 - Dam Breaching |
0.85 0.85 0.81 0.93 |
0.78 0.78 0.69 0.89 |
0.97 0.97 0.95 0.98 | |
| 48-Year Recovery | ||||
| Alternative 1 - Existing Condition Alternative 2 - Maximum Transport of Juvenile Salmon Alternative 3 - Major System Improvements Alternative 4 - Dam Breaching |
0.22 0.22 0.28 1.00 |
0.15 0.15 0.17 1.00 |
0.56 0.56 0.63 1.00 | |
| 100-Year Survival | ||||
| Alternative 1 - Existing Condition Alternative 2 - Maximum Transport of Juvenile Salmon Alternative 3 - Major System Improvements Alternative 4 - Dam Breaching |
0.83 0.83 0.78 0.98 |
0.71 0.71 0.64 0.97 |
0.98 0.98 0.95 1.00 | |
| Source: Personal communications from NMFS (from Lynn Krasnow, verified by Tom Cooney) | ||||
24-Year Survival Standard for Fall Chinook
All of the median results of the alternatives under consideration meet the 24th year survival standards, which as discussed above requires a 70% probability.
48-Year Recovery Standard for Fall Chinook
Alternative 3, Dam Breaching, is the only alternative under consideration, which meets the 48th year recovery standards, using the median results from the 1998 PATH modeling process. None of the median results of dam retention alternatives met the 48th year recovery standards under the modeling prepared in 1998, which as discussed above require a 50% result. In this case, the median results of the dam retention alternatives are not close to the recovery standard (e.g., within 22% to 28%), but the 75th percentile model results for these alternatives does exceed the recovery standard.
However, as noted at the end of this report, from PATH 1999 model results show that dam retention alternatives meet the 48-year recovery standard.
100-Year Survival Standard for Fall Chinook
All of the median results of the alternatives under consideration meet the 100th year survival standards, which as discussed above require a 70% probability.
8.2.1.4 1999 PATH Model Results
PATH is continuing to refine the model, using new information on key variables related to delayed mortality (the D factor), ocean conditions, and ocean harvests, among other variables. These modifications are having an affect on model results for fall chinook. According to the PATH Decision Analysis Report for Snake River Fall Chinook (September 1999):
Unfortunately, these results were reported too late to be included in the economic appendix. The reader is referred to section 5.4.3 of the EIS for a more detailed discussion of PATH model results.
8.2.2 AFISH Economic Team Model Results
As mentioned above, the AFISH economics team worked with NMFS and PATH staff to extrapolate the results of the PATH models from the weakest stocks to all spring/summer and fall chinook stocks as well as to steelhead stocks. The following section summarizes the results of this effort, which is based upon the 1998 model results. Using the 1999 model results will increase the number of fish associated with the dam retention alternatives and decrease the differential in output between dam retention alternatives and the dam breaching alternative.
As shown in Figure 8.1, the dam breaching alternative (using the 1998 PATH model results) generates approximately 30,000 more fish than is expected under the base case (A-1) approximately 25 years after implementation of dam breaching. The AFISH team estimates that the increase would consist of approximately 3,000 more steelhead, 14,000 more spring/summer chinook and 13,000 more fall chinook. This level of increase represents an approximate doubling (e.g., 100% increase) of the wild fish escapement under the dam breaching alternative over the level expected under the base case (e.g., the base case reaches 35,000 fish during the same time period).
The dam retention alternatives (A-2a and A-2c) generate approximately 1,000 more fish than under the base case conditions, consisting mainly of spring/summer chinook.
The AFISH economic team has not prepared revised estimates based upon the 1999 model results.
8.2.2.1 Harvest Standards
In addition to the survival and recovery standards, there may be harvest goals, which were not considered by PATH. These thresholds may be defined as a level of recovery which, in the judgment of the tribes, will lead to significantly increased tribal harvest, and commensurate significant improvement in cultural and material well being for tribal peoples. (Defined by Meyer Resources, Inc.).
However, no measurable harvest goals were proposed during the course of the study. The tribal group has reported that the harvestable goals are met under the dam breaching alternative (A-3) but not under other alternatives under the 1998 PATH model results. It is unknown whether the harvest goals would be met for dam retention alternatives using the 1999 PATH model results (See the Tribal Circumstance Chapter for more details).
8.3 Discussion of Net Cost Factors
Evaluation of environmental restoration and mitigation solutions requires an evaluation of monetary effects (or factors) in four general classes. When combined, these effects form the "net cost" information for cost effectiveness analyses, described in greater detail below.
8.3.1 Definition of Net NED Costs
Net costs are defined to include all NED effects, including:
Net NED costs are defined to equal implementation costs plus avoided costs plus NED costs less NED benefits.
8.3.2 Presentation of Annual Results
Table 8-3 presents the low, most likely and high net NED annualized costs, as defined in the previous sections. Again, all comparative estimates are net of the base case.
Under the most likely case and a 6 7/8% discount rate:
|
Table 8-3 Annualized Net Cost Comparison ($1,000s) | |||
| Rate | Most Likely | Low | High |
| At 6.875% | |||
| Alternative 2 less Alternative 1 Alternative 3 less Alternative 1 Alternative 4 less Alternative 1 |
$(14,147) $(4,810) $246,474 |
$(15,366) $(6,501) $220,758 |
$(11,355) $1,743 $276,569 |
| At 4.75% | |||
| Alternative 2 less Alternative 1 Alternative 3 less Alternative 1 Alternative 4 less Alternative 1 |
$(13,172) $(6,268) $245,467 |
$(14,425) $(7,876) $220,378 |
$(10,236) $(78) $274,192 |
| At 0.0% | |||
| Alternative 2 less Alternative 1 Alternative 3 less Alternative 1 Alternative 4 less Alternative 1 |
$(10,281) $(7,978) $208,810 |
$(11,116) $(8,944) $184,439 |
$(8,095) $(4,400) $235,284 |
| Source: Implementation/Avoided Cost Chapter (tables 3.8-4 and 3.8-5), Hydropower chapter (Table 3.4-22), Transportation chapter (Table 3.3-34), Water Supply chapter (Table 3.4-17), Recreation chapter (Table 3.4-8), and the Anadromous Fish chapter (Table 3.5-3). | |||
Under the most likely case and a 4 3/4% discount rate, Alternative 2 is $13.2 million less costly, Alternative 3 is $6.2 million less costly and Alternative 4 is $245.5 million more costly than the existing conditions annually over the 100-year study period.
Under the most likely case and a 0.0% discount rate, Alternative 2 is $10.3 million less costly, Alternative 3 is $8.0 million and Alternative 4 is $208.8 million more costly than the existing conditions annually over the 100-year study period.
8.4 Cost Effectiveness Comparisons
The following section provides a graphical and tabular comparison of the net NED costs and biological effectiveness for spring/summer chinook and fall chinook, separately, taking into account both the NMFS jeopardy standards and the estimated number of fish associated with each alternative. There are no PATH/NMFS estimates of the combined probabilities of meeting the jeopardy standards for both spring/summer and fall chinook salmon.
The cumulative costs are calculated by multiplying the annual costs by the number of years of the applied standard. As an example, Alternative 4, Dam Breaching costs $5.9 billion to administer over a 24-year period (e.g., 24 years times the annual cost of $246,474,000 equals $5,915,367,000). The total number of fish is calculated in a similar manner. As an example, Alternative 4, Dam Breaching, generates 168,612 more fish during the first 24-year period than does Alternative 1, Existing Conditions.
The cost effectiveness assessment considers two different but related perspectives to determine the least costly means of meeting the NMFS jeopardy standards:
8.4.1 CE Assessment 1 - All Costs Applied to Spring/Summer Chinook
Figures 8-2 through 8-4 and Table 8-4 present a comparison of the net NED cost and net biological effectiveness to achieve the NMFS’ jeopardy standards for spring/summer chinook for the various alternatives under consideration. This cost effectiveness assessment considers the entire cost of the alternatives applied to spring/summer chinook.
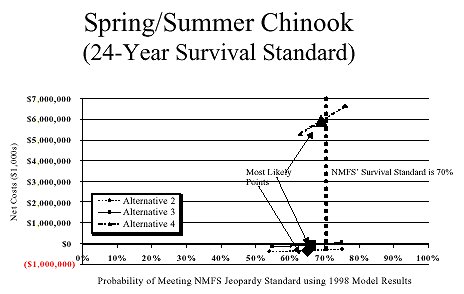
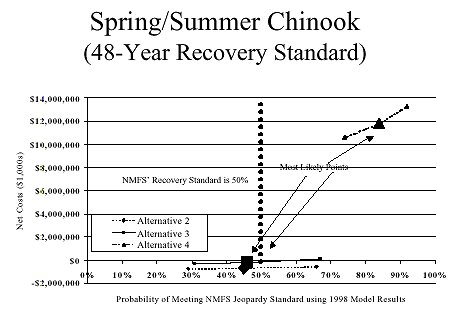
Figure 8-3. Net Cost and Biological Effectiveness Comparison for Meeting the NMFS' 48-Year Recovery Standards for Spring/Summer Chinook Using 1998 PATH Model Results
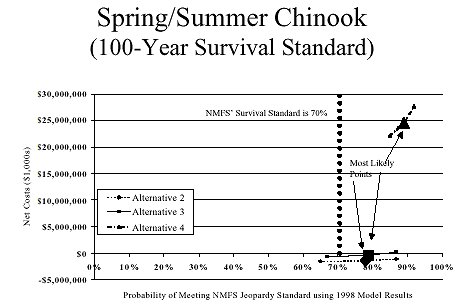
Figure 8-4. Net Cost and Biological Effectiveness Comparison for Meeting the NMFS' 100-Year Survival Standards for Spring/Summer Chinook Using 1998 PATH Model Results
|
Table 8-4 Incremental Comparison of Net Costs (in $1,000s) And Biological Effectiveness for Spring/Summer Chinook |
|||||
| Standard by Alternative | Cost | Percent | Cost Per Percent | Total Fish | Cost per Fish |
| 24-Year Standard | |||||
| Alternative 2 less Alternative 1 Alternative 3 less Alternative 1 Alternative 4 less Alternative 1 |
$(339,522) $(115,448) $5,915,367 |
(2.0) (1.0) 2.0 |
$169,761 $115,448 $2,957,684 |
25,699 40,934 168,612 |
$(13) $(3) $35 |
| 48-Year Standard | |||||
| Alternative 2 less Alternative 1 Alternative 3 less Alternative 1 Alternative 4 less Alternative 1 |
$(679,045) $(230,896) $11,830,735 |
(3.0) (2.0) 36.0 |
$226,348 $115,448 $328,632 |
46,046 78,012 556,370 |
$(15) $(3) $21 |
| 100-Year Standard | |||||
| Alternative 2 less Alternative 1 Alternative 3 less Alternative 1 Alternative 4 less Alternative 1 |
$(1,414,677) $(48,034) $24,647,365 |
(1.0) -- 10.0 |
$1,414,677 NM $2,464,736 |
82,855 78,012 1,419,466 |
$(17) $(6) $17 |
| Note: This table uses 1998 PATH model
results, 1999 model results are not available in the
same format. Source: BST Associates, using data from the Economic Appendix, NMFS, and PATH. |
|||||
8.4.1.1 24-Year Survival Standard for Spring/Summer Chinook
As noted above, under the most likely (median) conditions, none of the alternatives meet the 24-year survival standard for spring/summer chinook. However, all alternatives are relatively close to the goal (e.g., within 3% for Alternative 1, 5% for Alternative 2, 4% for Alternative 3, and 1% for Alternative 4).
The cumulative costs associated with Alternatives 2 and 3 are lower than those under Alternative 1, resulting in net savings. However, the probability of meeting the 24-year survival standard is also lower under these alternatives than under Alternative 1. Each percentage of improved survival is estimated to cost approximately $169.8 million under Alternative 2, Maximum Transport, and $115.5 million under Alternative 3, Major System Improvement over the 24-year period.
There is only a marginal improvement associated with selecting Alternative 4, Dam Breaching, over Alternative 1, Existing Conditions, but this occurs at a high cost. Each additional percentage of survival attained in moving from Alternative 1, Existing Conditions, to Alternative 4, Dam Breaching, is expected to cost approximately $3.0 billion in cumulative costs over the 24-year period. Each additional spring/summer chinook produced under Alternative 4 is estimated to cost $35,000 per fish over the 24-year period, using the 1998 PATH model results. (See Figure 8-2 and Table 8-3).
8.4.1.2 48-Year Recovery Standard for Spring/Summer Chinook
Only the dam breaching alternative meets the 48-year recovery standard using the 1998 PATH model results. The dam retention alternatives are relatively close (e.g., within 2% to 5%) of meeting the recovery standard under the median values. All alternatives attain the standard under the high-end of the probability distribution (e.g., at the 75th percentile).
The costs associated with Alternatives 2 and 3 are lower than those under Alternative 1, resulting in a net savings. However, the probability of meeting the NMFS 48-year standard is lower under these alternatives than under Alternative 1. Each percentage of improved survival is estimated to cost $226.3 million under Alternative 2 and $115.5 million under Alternative 3.
Each additional percentage attained from moving from Alternative 1, Existing Conditions (48% probability of attaining recovery) to Alternative 4, Dam Breaching (84% probability of recovery) is expected to cost $328.6 million over the 48-year period. Each fish attained by moving from Alternative 1, Existing Conditions, to Alternative 4, Dam Breaching is expected to cost approximately $21,000 per fish. (See Figure 8-3 and Table 8-3.)
8.4.1.3 100-Year Survival Standard for Spring/Summer Chinook
All alternatives meet the 100-year survival standard. (See Figure 8-4 and Table 8-3). Attaining an additional percentage of survival under Alternative 2 would cost approximately $1.4 billion.
Alternatives 1 and 3 have the same median probability of meeting the 100-year standard. Each additional percentage attained from moving from Alternative 1, Existing Conditions (79% probability of attaining recovery) to Alternative 4, Dam Breaching (89% probability of recovery) is expected to cost $2.5 billion over the 100-year period. Each fish attained by moving from Alternative 1, Existing Conditions, to Alternative 4, Dam Breaching is expected to cost approximately $17,000 per fish. (See Figure 8-4 and Table 8-3.)
8.4.2 CE Assessment 2 -- All Costs Applied to Fall Chinook
Figures 8-5 through 8-7 and Table 8-5 present a comparison of the net cost and biological effectiveness to achieve the NMFS’ jeopardy standards for fall chinook for the various alternatives under consideration. This cost effectiveness assessment considers the entire cost of the alternatives applied to fall chinook.
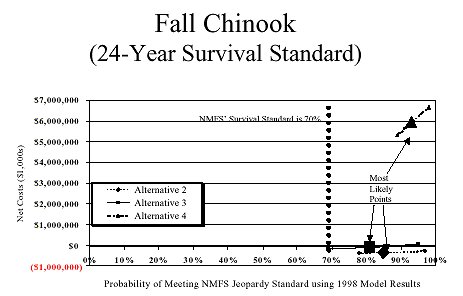
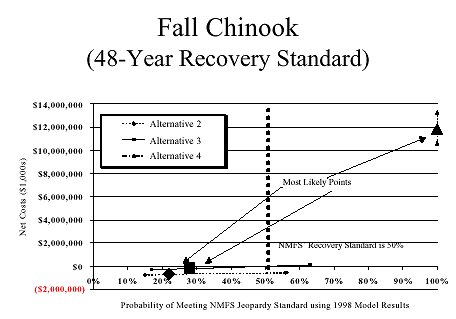
Figure 8-6. Net Cost and Biological Effectiveness Comparison for Meeting the NMFS' 48-Year Recovery Standards for Fall Chinook using 1998 PATH Model Results
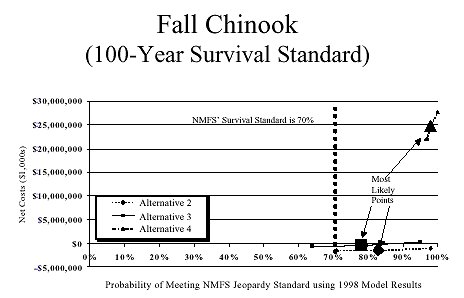
Figure 8-7. Net Cost and Biological Effectiveness Comparison for Meeting the NMFS' 100-Year Survival Standards for Fall Chinook using 1998 PATH Model Results
|
Table 8-5 Incremental Comparison of Net Costs (in $1,000s) And Biological Effectiveness for Fall Chinook Using 1998 PATH Model Results | |||||
| Standard by Alternative | Cost | Percent | Cost Per Percent | Total Fish | Cost per Fish |
| 24-Year Standard | |||||
| Alternative 2 less Alternative 1 Alternative 3 less Alternative 1 Alternative 4 less Alternative 1 |
$(339,522) $115,448) $5,915,367 |
-- (4.0) 8.0 | -- $28,862 $739,421 |
-- 4,524 205,443 | -- $(26) $29 |
| 48-Year Standard | |||||
| Alternative 2 less Alternative 1 Alternative 3 less Alternative 1 Alternative 4 less Alternative 1 |
$(679,045) $(230,896) $11,830,735 |
-- 6.0 78.0 | -- $(38,483) $151,676 |
-- 11,735 524,959 |
-- $(20) $23 |
| 100-Year Standard | |||||
| Alternative 2 less Alternative 1 Alternative 3 less Alternative 1 Alternative 4 less Alternative 1 |
$(1,414,677) $(481,034) $24,647,365 |
-- (5.0) 15.0 |
-- $96,207 $1,643,158 |
-- 25,444 1,207,274 |
-- $(19) $20 |
| Note: This table uses 1998 PATH model
results, 1999 model results are not available in the
same format. Source: BST Associates, using data from the Economic Appendix, NMFS, and PATH. |
|||||
8.4.2.1 24-Year Survival Standard for Fall Chinook
Under the most likely (median) conditions, all of the alternatives meet the 70% survival standard on the 24th-year. The probability of success is the same for Alternatives 1 and 2. Hence there is no cost differential per percentage gained between these alternatives. However, Alternative 2 is $339.5 million less costly than Alternative 1.
The increase in one percentage probability in moving from Alternative 1, Existing Conditions, to the Alternative 3, Major System Improvements, is expected to cost $28.8 million over the 24-year period. (See Figure 8-5 and Table 8-4.) The increase in one percentage probability in Alternative 1, Existing Conditions, to the Alternative 4, Dam Breaching is expected to cost $739.4 million over the 24-year period. Each additional fish gained by dam breaching is estimated to cost $29,000 per fish. (See Figure 8-5 and Table 8-4.)
8.4.2.2 48-Year Recovery Standard for Fall Chinook
Only the dam breaching alternative meets the 48-year recovery standard using the 1998 PATH model results. The dam retention alternatives are not close to meeting this recovery standard (between 22% to 28% away from the 50% recovery standard), using the 1998 model results.
The benefit in moving from Alternative 1, Existing Conditions, to Alternative 3, Major System Improvements, is expected to save $38.5 million over the 48-year period. (See Figure 8-5 and Table 8-4.)
Each additional percentage of survival attained from moving from Alternative 1 (22% probability of attaining recovery) to Alternative 4 (100% probability of recovery) is expected to cost $151.7 million per year over the 48-year period. Each fish attained by moving from Alternative 1 to Alternative 3 is expected to cost approximately $23,000 per fish. (See Figure 8-6 and Table 8-4.)
8.4.2.3 100-Year Survival Standard for Fall Chinook
All alternatives meet the 100-year survival standard. (See Figure 8-7 and Table 8-4.) The benefit in moving from Alternative 1, Existing Conditions, to Alternative 3, Major System Improvements, is expected to cost $96.2 million over the 100-year period. (See Figure 8-5 and Table 8-4.)
Each additional percentage of survival attained from moving from Alternative 1 to Alternative 4 is expected to cost $1.6 billion per year over the 100-year period. Each fish attained by moving from A-1 to A-3 is expected to cost approximately $20,000 per fish. (See Figure 8-6 and Table 8-4.)
8.4.3 CE Assessment 3 - Costs Applied to all Fish
A comparison of the net cost and biological effectiveness to achieve the NMFS jeopardy standards across spring/summer and fall chinook and steelhead for the various alternatives under consideration is presented in Table 8-6. This cost effectiveness assessment spreads the cost of the alternatives to all fish, as determined by the anadromous fish working group. As mentioned previously, there is no combined probability associated with meeting the NMFS standards across all impacted species.
|
Table 8-6 Incremental Comparison of Net Costs (in $1,000s) and Biological Effectiveness for Spring/Summer and Fall Chinook and for Steelhead Using 1998 PATH Model Results, As Extrapolated by the Anadromous Fish Working Group | |||
| Standard by Alternative | Cumulative Cost |
Total Fish |
Cost per Fish |
| 24-Year Standard | |||
| Alternative 2 less Alternative 1 Alternative 3 less Alternative 1 Alternative 4 less Alternative 1 |
$(339,522) $(115,448) $5,915,367 |
29,757 38,936 403,115 |
$(11) $(3) $15 |
| 48-Year Standard | |||
| Alternative 2 less Alternative 1 Alternative 3 less Alternative 1 Alternative 4 less Alternative 1 |
$(679,045) $(230,896) $11,830,735 |
48,157 72,220 1,188,900 |
$(14) $(3) $10 |
| 100-Year Standard | |||
| Alternative 2 less Alternative 1 Alternative 3 less Alternative 1 Alternative 4 less Alternative 1 |
$(1,414,677) $(481,034) $24,647,365 |
78,634 131,429 2,915,720 |
$(18) $(4) $8 |
| Note: This table uses 1998 PATH model
results, 1999 model results are not available in a
similar format. Source: BST Associates, using data from the Economic Appendix, NMFS, and PATH. |
|||
8.4.3.1 24-Year Survival Standard for all Fish
Alternatives 2 and 3 are estimated to generate more fish than Alternative 1 at a reduced cost. The savings from choosing these alternatives is estimated to be $11,000 and $3,000 per fish over the 24-year survival standard, for each respective alternative. The additional cost of moving from Alternative 1, Existing Conditions, to Alternative 4, Dam Breaching, is estimated to be $15,000 per fish over the 24-year period. (See Figure 8-5 and Table 8-4).
8.4.3.2 48-Year Recovery Standard for all Fish
The savings from choosing Alternatives 2 or 3 is estimated to be $14,000 and $3,000 per fish over the 48-year recovery standard, respectively. The additional cost of moving from Alternative 1, Existing Conditions, to Alternative 4, Dam Breaching, is estimated to be $10,000 per fish over the 48-year period. (See Figure 8-5 and Table 8-4.)
8.4.3.3 100-Year Survival Standard for all Fish
The savings from choosing Alternatives 2 or 3 is estimated to be $18,000 and $4,000 per fish over the 100-year survival standard, respectively. The additional cost of moving from Alternative 1, Existing Conditions, to Alternative 4, Dam Breaching, is estimated to be $8,000 per fish over the 100-year period. (See Figure 8-5 and Table 8-4.)
8.5 Conclusions
8.5.1 Biological Considerations
8.5.1.1 1998 Model Results
None of the alternatives meets all of the jeopardy standards using 1998 PATH model results.
Alternative 4, Dam Breaching, comes the closest to meeting all of the jeopardy standards for both spring/summer and fall chinook (e.g., 5 out of 6 standards).
The dam retention alternatives come relatively close to meeting all of the jeopardy standards, with the exception of the 48-year recovery standard for fall chinook.
8.5.1.2 1999 Model Results
As discussed previously, PATH is continuing to refine the model, using new information on key variables related to delayed mortality (the D factor), ocean conditions, and ocean harvests, among other variables. These modifications are having an affect on model results for fall chinook, in the following ways:
Unfortunately, the 1999 model results were reported too late to be included in the economic appendix.
8.5.2 Cost Effectiveness Analysis
The following conclusions use the 1998 model results, which suggested a larger variation in output between dam retention and dam breaching alternatives. Model results from 1999 suggest that the difference is much narrower between these alternatives than stated in the 1998 model results. As a consequence, the cost effectiveness results based on 1998 model results over-state the benefits from dam breaching relative to dam retention.
8.5.2.1 CE Assessment 1 - Costs Applied to Spring/Summer Chinook
There is little difference between the dam retention alternatives and the dam breaching alternative with respect to meeting the NMFS jeopardy standards for spring/summer chinook. As a result, dam breaching creates little additional biological output using 1998 model results but is significantly more costly. The additional cost of choosing Alternative 4, Dam Breaching, as opposed to Alternative 1, Existing Conditions, is estimated at $17,000 to $35,000 per fish, depending on the year under consideration (e.g., the cost decreases as the number of years increases).
8.5.2.2 CE Assessment 2 - Costs Applied to Fall Chinook
Under the 1998 model results, the dam retention alternatives meet the 24-year and 100-year survival standards but are not close to meeting the 48-year recovery standard. The additional cost of choosing Alternative 4, Dam Breaching, as opposed to Alternative 1, Existing Conditions, is estimated at $20,000 to $29,000 per fish, depending on the year under consideration (e.g., the cost decreases as the number of years increases).
Since dam retention alternatives meet or come close to meeting the NMFS jeopardy standards for spring/summer chinook but not for fall chinook using the 1998 model results, dam breaching could be considered preferred for fall chinook but unnecessary for spring/summer chinook.
8.5.2.3 CE Assessment 3 - Costs Applied to all Fish
Alternatives 2 and 3 are estimated to generate more fish than Alternative 1 at a reduced cost. The savings from choosing Alternative 2 is estimated to range between $11,000 and $18,000 per fish, depending upon the number of years under consideration. The savings from choosing Alternative 3 is estimated to range between $3,000 and $8,000 per fish, depending upon the number of years under consideration.
The additional cost of choosing Alternative 4, Dam Breaching, is estimated to be between $8,000 and $15,000 per fish, depending upon the number of years under consideration.
8.5.2.4 Implications of the 1999 Model Results
The 1999 model results have the following qualitative implications:
Although the 1999 model results are not available in a similar format as those prepared in 1998, the biological benefits of the dam retention alternatives improve markedly while the biological benefits of the dam breaching alternative does not change markedly. This new information suggests that all of the NMFS jeopardy standards can be met under dam retention alternatives at much lower cost than under dam breaching.
8.5.3 Unresolved Issues
The Economics Appendix was prepared before the PATH 1999 model results were available. The major unresolved issue in this chapter is updating the data results that would be expected to change as a result of the 1999 PATH model results. As described above, this includes:
Return to the Products Page