(TANF)
Sixth Annual Report to Congress
The TANF Child Poverty Regulation
Annual Federal poverty measures are generated from Census Bureau surveys of household income by looking at the amount of cash income received by the individual or family. Non-cash transfers (e.g., food stamps and housing subsidies) are not included in the income definition, nor are subtractions or additions to income made through the tax system. An individual's or a family's poverty status is assessed by comparing total cash income to a standard of basic needs (the poverty threshold) which varies by the size of the family. In 2002, the Federal poverty threshold for a family of four (two adults plus two children) was $18,244.
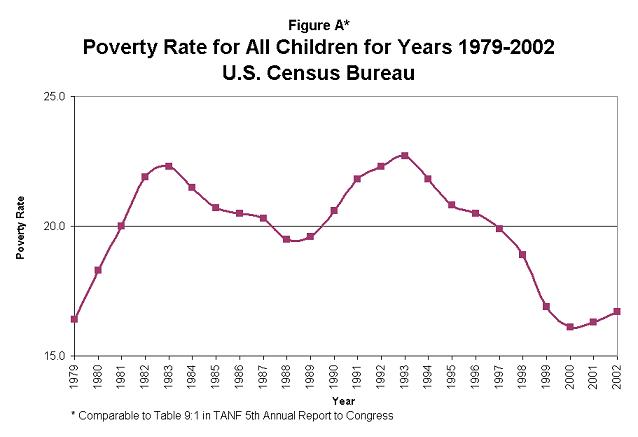
Between 1996 and 2002, the national child poverty rate fell by almost 18.5 percent (from 20.5 percent to 16.7 percent). These data are presented in Figure A and Table A. The decline is even more marked for specific groups: the African American child poverty rate dropped from 39.9 percent to 31.5 percent, and the Hispanic child poverty rate dropped from 40.3 percent to 28.6 percent.
| Poverty Rate | 1979 | 1980 | 1981 | 1982 | 1983 | 1984 | 1985 | 1986 | 1987 | 1988 | 1989 | 1990 | 1991 | 1992 | 1993 | 1994 | 1995 | 1996 | 1997 | 1998 | 1999 | 2000 | 2001 | 2002 |
|---|---|---|---|---|---|---|---|---|---|---|---|---|---|---|---|---|---|---|---|---|---|---|---|---|
| Official Measure | 16.4 | 18.3 | 20.0 | 21.9 | 22.3 | 21.5 | 20.7 | 20.5 | 20.3 | 19.5 | 19.6 | 20.6 | 21.8 | 22.3 | 22.7 | 21.8 | 20.8 | 20.5 | 19.9 | 18.9 | 16.9 | 16.2 | 16.3 | 16.7 |
| * Comparable to Table 9:2 in TANF 5th Annual Report to Congress | ||||||||||||||||||||||||
| Source: U.S. Census Bureau |
There are also significant differences in the child poverty rate by marital status. In married, two parent families, about one child in 12 is poor (8.0 percent), while about 39 percent of the children living in female-headed, single parent families are poor.
The Census Bureau also produces a series of poverty statistics using alternative definitions of income that incorporate other additions and reductions to income, such as capital gains and losses, near-cash transfers, and Federal and State taxes including the payroll tax and the Earned Income Tax Credit (EITC). Using this expanded definition of income, the 2002 child poverty rate is reduced to 12.8 percent from 16.7 percent based on the official definition. Inclusion of the EITC alone moved more than 2.4 million poor children above the poverty rate.
While the poverty rate indicates the proportion of the population that is poor, the poverty gap illustrates the income profile of those in poverty by measuring the amount of money that would be required to raise all poor families to the poverty line. Table B displays the poverty gap for families with children from 1991 to 2002 using a pre-transfer measure of the poverty gap, the official measure of poverty, and an alternative measure of poverty that includes near-cash transfers and Federal and State taxes, including the EITC.
| YEAR | PRE-TRANSFER POVERTY GAP | OFFICIAL POVERTY MEASURE GAP | REDUCTION IN GAP (pretransfer - official) | COMPREHENSIVE MEASURE OF POVERTY GAP | REDUCTION IN GAP (pretransfer - comprehensive) |
|---|---|---|---|---|---|
| 1991 | 85.5 | 51.6 | 33.9 | 33.7 | 51.8 |
| 1992 | 88.4 | 53.4 | 35.0 | 35.9 | 52.5 |
| 1993 | 96.1 | 57.3 | 38.8 | 39.9 | 56.2 |
| 1994 | 89.5 | 53.6 | 35.9 | 35.9 | 53.6 |
| 1995 | 80.2 | 47.8 | 32.4 | 27.9 | 52.3 |
| 1996 | 80.1 | 49.2 | 30.9 | 28.4 | 51.7 |
| 1997 | 77.3 | 48.7 | 28.6 | 29.8 | 47.5 |
| 1998 | 68.6 | 45.8 | 22.8 | 28.2 | 40.4 |
| 1999 | 62.3 | 41.3 | 21.0 | 25.8 | 36.5 |
| 2000 | 58.0 | 40.3 | 17.7 | 26.1 | 31.9 |
| 2001 | 61.0 | 42.2 | 18.8 | 27.7 | 33.3 |
| 2002 | 64.2 | 43.6 | 20.6 | 28.3 | 35.9 |
While overall child poverty levels are affected by various factors, earnings are central to assisting families in escaping poverty and States have made remarkable progress since the enactment of TANF in moving families into work. However, many families who have moved to work have not yet escaped poverty. Many States are now focusing more on helping families move beyond taking a job to successfully retaining and advancing in employment. Some measure of how well States are doing in this regard is reflected in the data from the States competing for the TANF High Performance Bonus awards. Job entry, job retention, and job advancement are the three work measures used in the High Performance Bonus system (for more information, see Chapter V: High Performance Bonus).
In addition, a number of innovative States are using the resources and flexibility under TANF to not only increase employment and reduce dependence, but also to directly or indirectly make more income available to aided families. Such strategies include:
Congressional concern regarding the effect of the TANF program on the well being of children led to the 1996 enactment of section 413(i) of the Social Security Act. This provision requires the Department of Health and Human Services (HHS) to monitor changes in the child poverty rate relative to TANF. If the State experiences an increase in its child poverty rate of five percent or more as a result of the TANF program(s) in the State, it must submit and implement a corrective action plan to reduce the State's child poverty rate.
HHS published a final rule to implement this section of the law on June 23, 2000 (65 FR 39233). To date, based on child poverty rates for 1996, 1997, 1998 and 1999, no State was required to submit a corrective action plan or any additional information for these child poverty assessment periods. Child poverty rates by State are presented in Tables C, D and E.
|
State
|
1996 | 1997 | ||||
|---|---|---|---|---|---|---|
| Point Estimate % |
90% Confidence Interval | Point Estimate % |
90% Confidence Interval | |||
| Lower Bound % |
Upper Bound % |
Lower Bound % |
Upper Bound % |
|||
| United States | 20.5 | 19.8 | 21.1 | 19.9 | 19.2 | 20.6 |
| Alabama | 25.0 | 23.1 | 27.0 | 23.8 | 21.8 | 25.7 |
| Alaska | 14.8 | 12.7 | 17.0 | 16.2 | 13.9 | 18.4 |
| Arizona | 24.5 | 22.2 | 26.7 | 23.2 | 21.2 | 25.2 |
| Arkansas | 25.7 | 23.5 | 27.8 | 25.0 | 22.8 | 27.2 |
| California | 25.3 | 23.6 | 27.0 | 24.6 | 22.9 | 26.3 |
| Colorado | 14.3 | 12.6 | 16.1 | 14.6 | 12.7 | 16.6 |
| Connecticut | 14.8 | 12.5 | 17.1 | 14.7 | 12.6 | 16.8 |
| Delaware | 15.3 | 13.5 | 17.1 | 15.4 | 13.6 | 17.2 |
| Dist. of Col. | 36.1 | 32.9 | 39.3 | 33.7 | 30.2 | 37.3 |
| Florida | 22.3 | 20.7 | 23.9 | 21.8 | 20.0 | 23.5 |
| Georgia | 23.0 | 21.2 | 24.7 | 22.8 | 21.0 | 24.6 |
| Hawaii | 17.9 | 15.4 | 20.4 | 16.2 | 13.7 | 18.8 |
| Idaho | 15.9 | 13.9 | 17.9 | 17.3 | 15.2 | 19.3 |
| Illinois | 18.4 | 16.8 | 19.9 | 17.5 | 15.9 | 19.0 |
| Indiana | 13.0 | 11.2 | 14.8 | 14.8 | 13.0 | 16.6 |
| Iowa | 12.6 | 10.9 | 14.3 | 13.7 | 11.9 | 15.5 |
| Kansas | 14.3 | 12.5 | 16.0 | 15.4 | 13.6 | 17.3 |
| Kentucky | 25.5 | 23.6 | 27.5 | 23.1 | 21.2 | 25.0 |
| Louisiana | 29.9 | 27.8 | 32.1 | 26.0 | 23.8 | 28.1 |
| Maine | 17.0 | 14.8 | 19.2 | 14.9 | 12.7 | 17.1 |
| Maryland | 14.4 | 12.5 | 16.2 | 14.9 | 12.9 | 16.8 |
| Massachusetts | 14.7 | 12.8 | 16.5 | 17.0 | 14.9 | 19.0 |
| Michigan | 19.0 | 17.3 | 20.6 | 18.0 | 16.2 | 19.8 |
| Minnesota | 11.7 | 9.9 | 13.5 | 13.1 | 11.3 | 15.0 |
| Mississippi | 29.9 | 27.3 | 32.6 | 24.5 | 22.0 | 26.9 |
| Missouri | 18.4 | 16.5 | 20.4 | 17.7 | 15.9 | 19.4 |
| Montana | 21.6 | 19.4 | 23.8 | 21.3 | 19.4 | 23.3 |
| Nebraska | 12.7 | 10.8 | 14.6 | 12.6 | 10.8 | 14.5 |
| Nevada | 13.7 | 11.8 | 15.6 | 15.4 | 13.5 | 17.3 |
| New Hampshire | 7.8 | 5.9 | 9.7 | 10.0 | 7.9 | 12.1 |
| New Jersey | 13.8 | 12.2 | 15.4 | 14.8 | 13.2 | 16.5 |
| New Mexico | 29.8 | 27.4 | 32.1 | 27.5 | 25.0 | 29.9 |
| New York | 25.2 | 23.5 | 27.0 | 24.7 | 23.0 | 26.4 |
| North Carolina | 18.8 | 17.2 | 20.5 | 18.6 | 16.9 | 20.3 |
| North Dakota | 15.0 | 13.0 | 17.0 | 16.8 | 14.8 | 18.9 |
| Ohio | 17.0 | 15.4 | 18.6 | 16.0 | 14.5 | 17.6 |
| Oklahoma | 25.1 | 23.1 | 27.1 | 23.7 | 21.6 | 25.7 |
| Oregon | 17.6 | 15.5 | 19.8 | 16.3 | 14.1 | 18.4 |
| Pennsylvania | 16.5 | 14.9 | 18.0 | 16.6 | 15.0 | 18.1 |
| Rhode Island | 17.5 | 15.6 | 19.4 | 17.3 | 15.4 | 19.3 |
| South Carolina | 23.1 | 21.1 | 25.2 | 23.0 | 21.0 | 24.9 |
| South Dakota | 18.3 | 15.9 | 20.6 | 19.0 | 16.8 | 21.3 |
| Tennessee | 21.7 | 19.6 | 23.8 | 18.9 | 16.9 | 21.0 |
| Texas | 25.8 | 24.1 | 27.6 | 23.6 | 21.9 | 25.2 |
| Utah | 11.3 | 9.3 | 13.3 | 12.5 | 10.4 | 14.5 |
| Vermont | 14.9 | 12.6 | 17.3 | 12.7 | 10.3 | 15.0 |
| Virginia | 16.6 | 14.9 | 18.3 | 17.0 | 15.3 | 18.7 |
| Washington | 16.7 | 14.8 | 18.6 | 15.2 | 13.3 | 17.1 |
| West Virginia | 29.8 | 27.0 | 32.6 | 24.7 | 21.8 | 27.6 |
| Wisconsin | 12.2 | 10.2 | 14.2 | 14.3 | 12.1 | 16.4 |
| Wyoming | 14.3 | 12.4 | 16.3 | 15.3 | 13.3 | 17.4 |
|
Note: A one-tailed Z-test
for the difference in proportions was used to calculate the change in
poverty rates from 1996 to 1997.
|
||||||
|
Source: U.S. Census Bureau
|
| State | 1997 | 1998 | ||||
|---|---|---|---|---|---|---|
| Point Estimate % |
90% Confidence Interval | Point Estimate % |
90% Confidence Interval | |||
| Lower Bound % |
Upper Bound % |
Lower Bound % |
Upper Bound % |
|||
| United States | 19.9 | 19.2 | 20.6 | 18.9 | 18.2 | 19.6 |
| Alabama | 23.8 | 21.8 | 25.7 | 23.4 | 21.0 | 25.8 |
| Alaska | 16.2 | 13.9 | 18.4 | 14.6 | 11.9 | 17.4 |
| Arizona | 23.2 | 21.2 | 25.2 | 22.6 | 20.3 | 25.0 |
| Arkansas | 25.0 | 22.8 | 27.2 | 23.5 | 20.6 | 26.3 |
| California | 24.6 | 22.9 | 26.3 | 22.8 | 21.1 | 24.4 |
| Colorado | 14.6 | 12.7 | 16.6 | 14.2 | 12.0 | 16.3 |
| Connecticut | 14.7 | 12.6 | 16.8 | 13.3 | 10.8 | 15.8 |
| Delaware | 15.4 | 13.6 | 17.2 | 15.0 | 12.7 | 17.3 |
| Dist. of Col. | 33.7 | 30.2 | 37.3 | 30.5 | 27.0 | 34.0 |
| Florida | 21.8 | 20.0 | 23.5 | 21.9 | 20.0 | 23.7 |
| Georgia | 22.8 | 21.0 | 24.6 | 21.8 | 19.4 | 24.1 |
| Hawaii | 16.2 | 13.7 | 18.8 | 15.0 | 12.5 | 17.5 |
| Idaho | 17.3 | 15.2 | 19.3 | 17.4 | 15.1 | 19.8 |
| Illinois | 17.5 | 15.9 | 19.0 | 15.4 | 13.5 | 17.4 |
| Indiana | 14.8 | 13.0 | 16.6 | 14.1 | 11.9 | 16.4 |
| Iowa | 13.7 | 11.9 | 15.5 | 13.8 | 11.5 | 16.0 |
| Kansas | 15.4 | 13.6 | 17.3 | 14.4 | 12.2 | 16.6 |
| Kentucky | 23.1 | 21.2 | 25.0 | 21.2 | 18.9 | 23.6 |
| Louisiana | 26.0 | 23.8 | 28.1 | 25.7 | 23.2 | 28.3 |
| Maine | 14.9 | 12.7 | 17.1 | 14.2 | 11.8 | 16.6 |
| Maryland | 14.9 | 12.9 | 16.8 | 12.6 | 10.0 | 15.1 |
| Massachusetts | 17.0 | 14.9 | 19.0 | 14.3 | 12.1 | 16.5 |
| Michigan | 18.0 | 16.2 | 19.8 | 16.8 | 14.9 | 18.8 |
| Minnesota | 13.1 | 11.3 | 15.0 | 12.6 | 10.3 | 14.9 |
| Mississippi | 24.5 | 22.0 | 26.9 | 23.9 | 21.2 | 26.6 |
| Missouri | 17.7 | 15.9 | 19.4 | 16.8 | 14.5 | 19.1 |
| Montana | 21.3 | 19.4 | 23.3 | 21.9 | 19.5 | 24.3 |
| Nebraska | 12.6 | 10.8 | 14.5 | 13.8 | 11.5 | 16.1 |
| Nevada | 15.4 | 13.5 | 17.3 | 15.0 | 12.8 | 17.2 |
| New Hampshire | 10.0 | 7.9 | 12.1 | 10.6 | 8.1 | 13.1 |
| New Jersey | 14.8 | 13.2 | 16.5 | 13.2 | 11.2 | 15.2 |
| New Mexico | 27.5 | 25.0 | 29.9 | 27.1 | 24.4 | 29.9 |
| New York | 24.7 | 23.0 | 26.4 | 23.3 | 21.4 | 25.2 |
| North Carolina | 18.6 | 16.9 | 20.3 | 19.4 | 17.3 | 21.5 |
| North Dakota | 16.8 | 14.8 | 18.9 | 17.3 | 14.9 | 19.8 |
| Ohio | 16.0 | 14.5 | 17.6 | 16.4 | 14.6 | 18.3 |
| Oklahoma | 23.7 | 21.6 | 25.7 | 23.2 | 20.7 | 25.7 |
| Oregon | 16.3 | 14.1 | 18.4 | 16.9 | 14.2 | 19.5 |
| Pennsylvania | 16.6 | 15.0 | 18.1 | 16.5 | 14.6 | 18.5 |
| Rhode Island | 17.3 | 15.4 | 19.3 | 16.3 | 13.9 | 18.7 |
| South Carolina | 23.0 | 21.0 | 24.9 | 21.5 | 19.1 | 24.0 |
| South Dakota | 19.0 | 16.8 | 21.3 | 17.6 | 14.8 | 20.4 |
| Tennessee | 18.9 | 16.9 | 21.0 | 18.5 | 16.1 | 20.9 |
| Texas | 23.6 | 21.9 | 25.2 | 22.4 | 20.6 | 24.2 |
| Utah | 12.5 | 10.4 | 14.5 | 12.7 | 10.3 | 15.0 |
| Vermont | 12.7 | 10.3 | 15.0 | 12.6 | 10.0 | 15.1 |
| Virginia | 17.0 | 15.3 | 18.7 | 14.2 | 11.7 | 16.7 |
| Washington | 15.2 | 13.3 | 17.1 | 13.7 | 11.4 | 16.1 |
| West Virginia | 24.7 | 21.8 | 27.6 | 24.2 | 21.7 | 26.7 |
| Wisconsin | 14.3 | 12.1 | 16.4 | 13.6 | 11.1 | 16.0 |
| Wyoming | 15.3 | 13.3 | 17.4 | 15.4 | 13.0 | 17.8 |
| State | 1998 | 1999 | ||||
|---|---|---|---|---|---|---|
| Point Estimate % |
90% Confidence Interval | Point Estimate % |
90% Confidence Interval | |||
| Lower Bound % |
Upper Bound % |
Lower Bound % |
Upper Bound % |
|||
|
United States
|
18.9 | 18.2 | 19.6 | 17.1 | 16.5 | 17.8 |
| 23.4 | 21.0 | 25.8 | 22.2 | 19.7 | 24.7 | |
|
Alaska
|
14.6 | 11.9 | 17.4 | 11.2 | 8.8 | 13.6 |
|
Arizona
|
22.6 | 20.3 | 25.0 | 18.8 | 16.3 | 21.3 |
|
Arkansas
|
23.5 | 20.6 | 26.3 | 21.8 | 19.2 | 24.5 |
|
California
|
22.8 | 21.1 | 24.4 | 20.2 | 18.7 | 21.8 |
|
Colorado
|
14.2 | 12.0 | 16.3 | 12.0 | 9.8 | 14.2 |
|
Connecticut
|
13.3 | 10.8 | 15.8 | 10.2 | 7.9 | 12.6 |
|
Delaware
|
15.0 | 12.7 | 17.3 | 14.0 | 11.5 | 16.5 |
|
Dist. of Col.
|
30.5 | 27.0 | 34.0 | 29.2 | 25.2 | 33.1 |
|
Florida
|
21.9 | 20.0 | 23.7 | 18.5 | 16.6 | 20.3 |
|
Georgia
|
21.8 | 19.4 | 24.1 | 18.3 | 15.9 | 20.7 |
|
Hawaii
|
15.0 | 12.5 | 17.5 | 14.5 | 11.9 | 17.0 |
|
Idaho
|
17.4 | 15.1 | 19.8 | 16.8 | 14.3 | 19.4 |
|
Illinois
|
15.4 | 13.5 | 17.4 | 15.0 | 13.2 | 16.8 |
|
Indiana
|
14.1 | 11.9 | 16.4 | 11.6 | 9.2 | 13.9 |
|
Iowa
|
13.8 | 11.5 | 16.0 | 11.0 | 8.6 | 13.3 |
|
Kansas
|
14.4 | 12.2 | 16.6 | 14.3 | 11.9 | 16.7 |
|
Kentucky
|
21.2 | 18.9 | 23.6 | 20.2 | 17.7 | 22.8 |
|
Louisiana
|
25.7 | 23.2 | 28.3 | 26.4 | 23.6 | 29.2 |
|
Maine
|
14.2 | 11.8 | 16.6 | 14.8 | 12.3 | 17.3 |
|
Maryland
|
12.6 | 10.0 | 15.1 | 10.1 | 7.7 | 12.5 |
|
Massachusetts
|
14.3 | 12.1 | 16.5 | 15.0 | 12.4 | 17.7 |
|
Michigan
|
16.8 | 14.9 | 18.8 | 14.2 | 12.4 | 16.1 |
|
Minnesota
|
12.6 | 10.3 | 14.9 | 9.3 | 7.1 | 11.6 |
|
Mississippi
|
23.9 | 21.2 | 26.6 | 26.1 | 23.1 | 29.1 |
|
Missouri
|
16.8 | 14.5 | 19.1 | 16.7 | 14.3 | 19.0 |
|
Montana
|
21.9 | 19.5 | 24.3 | 20.2 | 17.6 | 22.7 |
|
Nebraska
|
13.8 | 11.5 | 16.1 | 12.5 | 10.2 | 14.8 |
|
Nevada
|
15.0 | 12.8 | 17.2 | 15.3 | 12.9 | 17.6 |
|
New Hampshire
|
10.6 | 8.1 | 13.1 | 8.2 | 5.9 | 10.6 |
|
New Jersey
|
13.2 | 11.2 | 15.2 | 10.9 | 9.0 | 12.8 |
|
New Mexico
|
27.1 | 24.4 | 29.9 | 26.4 | 23.6 | 29.2 |
|
New York
|
23.3 | 21.4 | 25.2 | 21.0 | 19.3 | 22.8 |
|
North Carolina
|
19.4 | 17.3 | 21.5 | 17.3 | 15.2 | 19.4 |
|
North Dakota
|
17.3 | 14.9 | 19.8 | 15.6 | 13.1 | 18.1 |
|
Ohio
|
16.4 | 14.6 | 18.3 | 16.0 | 14.1 | 18.0 |
|
Oklahoma
|
23.2 | 20.7 | 25.7 | 19.7 | 17.1 | 22.3 |
|
Oregon
|
16.9 | 14.2 | 19.5 | 15.7 | 13.3 | 18.1 |
|
Pennsylvania
|
16.5 | 14.6 | 18.5 | 14.0 | 12.1 | 16.0 |
|
Rhode Island
|
16.3 | 13.9 | 18.7 | 16.2 | 13.5 | 18.8 |
|
South Carolina
|
21.5 | 19.1 | 24.0 | 19.2 | 16.7 | 21.6 |
|
South Dakota
|
17.6 | 14.8 | 20.4 | 15.4 | 12.4 | 18.3 |
|
Tennessee
|
18.5 | 16.1 | 20.9 | 18.1 | 15.8 | 20.5 |
|
Texas
|
22.4 | 20.6 | 24.2 | 21.8 | 20.0 | 23.5 |
|
Utah
|
12.7 | 10.3 | 15.0 | 10.0 | 7.6 | 12.3 |
|
Vermont
|
12.6 | 10.0 | 15.1 | 12.3 | 9.8 | 14.7 |
|
Virginia
|
14.2 | 11.7 | 16.7 | 12.4 | 10.1 | 14.7 |
|
Washington
|
13.7 | 11.4 | 16.1 | 13.1 | 10.8 | 15.5 |
|
West Virginia
|
24.2 | 21.7 | 26.7 | 23.8 | 21.1 | 26.5 |
|
Wisconsin
|
13.6 | 11.1 | 16.0 | 10.9 | 8.6 | 13.3 |
|
Wyoming
|
15.4 | 13.0 | 17.8 | 15.1 | 12.7 | 17.5 |
|
Note: A one-tailed Z-test
for the difference in proportions was used to calculate the change in
poverty rates from 1998 to 1999.
|
||||||
|
Source: U.S. Census Bureau
|
This document was last modified on
May-29-2008
.