(TANF)
Sixth Annual Report to Congress
I. Caseload
Child-Only Cases
The Economy
State Policies and Management
Eligibility
Case Flow
Sanctions
Separate State Programs (SSP)
Link to Appendices
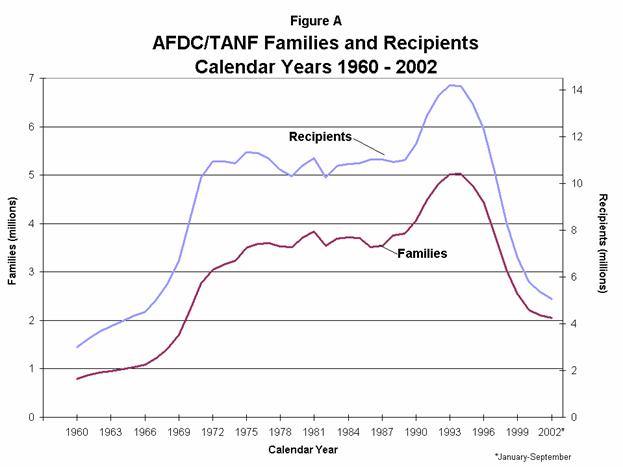
The national TANF caseload fell slightly during Fiscal Year (FY) 2002, continuing its long-term decline since the program's creation. Figure A shows the average number of families receiving benefits from 1960 through 2002 and the precipitous reduction that began in the mid-1990's and continues today.
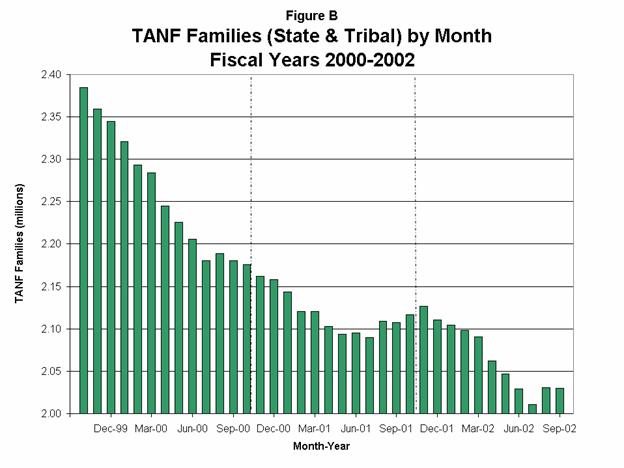
Compared with recent years, however, the caseload decline during FY 2002 was very modest. A total of 2,029,751 families in States, Territories, and Tribes were aided in September 2002, the last month of the fiscal year. Excluding Tribal TANF families (counts for which are incomplete), 73,413 fewer families received cash aid than at the end of FY 2001, representing a 3.5 percent decline in State and Territory TANF cases over the year. Figure B shows the number of families that received assistance each month in FYs 2000 through 2002.
This chapter reviews national caseload trends, changes in caseload composition and key factors affecting these trends. Tribal TANF programs, for example, are serving an increasing proportion of the national TANF caseload. Detailed information on the 36 Tribal TANF programs active during FY 2002 which served approximately 10,000 cases nationwide is included in Chapter XI. It is anticipated that many additional Tribes will elect to operate their own programs in the future.
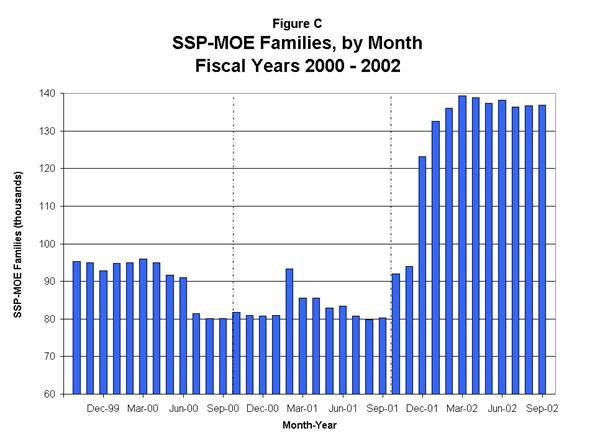
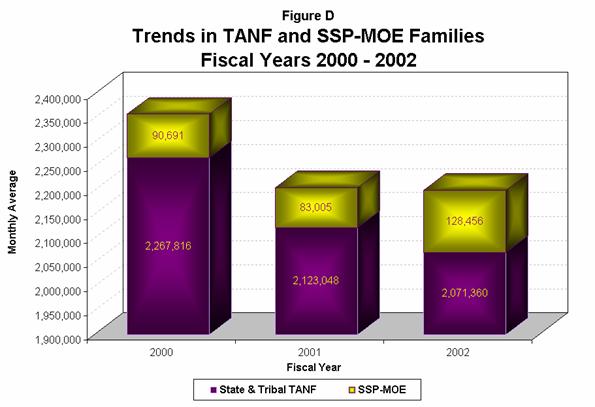
Here we also present counts of cases receiving cash aid through Separate State Programs (SSPs), which totaled about 137,000 families at the end of the fiscal year. Figure C shows the number of families that received assistance under SSPs each month in FYs 2000 through 2002. Some States are serving families through SSPs who have exhausted their time-limited Federal TANF benefits, and as time limits have begun to impact in nearly every State it is helpful to consider TANF and SSP case trends together. The jump in SSP families at the beginning of FY 2002 is due primarily to the fact that New York and a few other States have moved families that are reaching their Federal time limit to SSPs. Figure D shows the combined TANF and SSP caseload over the past three years. Despite the shift of time-limited cases, note that the combined caseload of both programs still declined slightly in FY 2002. It should be kept in mind that TANF is also used to provide services to many families not receiving cash aid (e.g., employed families receiving child care and transportation only), but for whom States do not report case counts.
While FY 2002's caseload decline was modest, the continuing reduction in dependency is impressive in light of the historically strong, but lagged correlation between rising unemployment rates and caseload growth in prior recessions. Despite the recent recession and caseload increases in some States, the total number of families on TANF at the end of FY 2002 was still 54 percent below what it was when TANF was enacted, a remarkable achievement.
All States and Territories except Indiana and Guam, respectively, remain substantially below their 1996 caseload levels. Thirty States have reduced caseloads by more than 50 percent and 13 by more than 60 percent. Wyoming has reduced the number of families on assistance by over 90 percent, Idaho and Illinois by over 80 percent, and Florida by over 70 percent. Wisconsin had achieved dramatic caseload declines prior to 1996 and its caseload is still more than 60 percent lower than in 1996. While the number of people receiving cash assistance has dropped significantly, expenditures for people receiving pre- and post-employment-related services have grown considerably, reflecting the redirection of public assistance under TANF to a focus on work.
Despite the steady national trend, there was considerable caseload variation among the States in FY 2002. Tables A and B show the number of families and recipients, respectively, by State as of September 2002, along with each State's percentage of the national caseload. These tables also compare and rank their change in caseload from both September 2001 and since the enactment of TANF in August 1996. During FY 2002, 30 of the 54 States and Territories saw continuing caseload declines, while 24 experienced increases. One-year caseload changes ranged from a 29 percent decline in New York to a 36 percent increase in Nevada, while the caseloads of 27 States remained quite stable with less than a five percent change. As noted earlier, the decline in New York reflects the fact that the first set of families reached their Federal time limits and some of these families were moved to SSPs. Understanding the significant variation across States is difficult, but we discuss some causal factors below. In addition, for the first time we present State by State profiles of TANF programs for FY 2002 in Chapter XIV.
Table A
Families - FY 2002
TANF and SSP Caseload Comparison
| State | Families at end of FY 2002 September 2002 |
Change Over FY 2002 September 2001 to September 2002 |
Change Since TANF Enactment August 1996 to September 2002 |
||||||
|---|---|---|---|---|---|---|---|---|---|
| Rank 1/ | Total | % of U.S. | Rank 2/ | Net Change 4/ | Rank 2/ | Net Change 4/ | |||
| U.S. Total | . | 2,166,639 | 100.00% | . | -16,851 | -0.80% | . | -2,383,006 | -54.10% |
| State & Terriroty TANF | . | 2,025,502 | 93.50% | . | -73,413 | -3.50% | . | -2,383,006 | -54.10% |
| SSP-MOE | . | 136,888 | 6.30% | . | 56,562 | 70.40% | . | - | - |
| All Tribal TANF 3/ | . | 4,249 | 0.20% | . | - | - | . | - | - |
| Alabama | 30 | 17,867 | 0.90% | 23 | -328 | -1.80% | 21 | -23,165 | -56.50% |
| Alaska | 47 | 5,583 | 0.30% | 27 | -54 | -1.00% | 23 | -6,576 | -54.10% |
| Arizona | 13 | 43,871 | 2.20% | 52 | 7,374 | 20.20% | 50 | -18,533 | -29.70% |
| Arkansas | 38 | 11,725 | 0.60% | 24 | -181 | -1.50% | 33 | -10,344 | -46.90% |
| California | 1 | 454,169 | 22.40% | 26 | -5,567 | -1.20% | 31 | -426,209 | -48.40% |
| Colorado | 37 | 12,444 | 0.60% | 50 | 1,589 | 14.60% | 7 | -22,042 | -63.90% |
| Connecticut | 23 | 22,592 | 1.10% | 6 | -3,400 | -13.10% | 13 | -34,734 | -60.60% |
| Delaware | 46 | 5,584 | 0.30% | 35 | 143 | 2.60% | 32 | -5,001 | -47.20% |
| Dist. of Col. | 32 | 16,434 | 0.80% | 33 | 344 | 2.10% | 45 | -8,916 | -35.20% |
| Florida | 8 | 58,315 | 2.90% | 25 | -868 | -1.50% | 4 | -142,607 | -71.00% |
| Georgia | 9 | 54,867 | 2.70% | 40 | 3,385 | 6.60% | 22 | -68,462 | -55.50% |
| Guam | 50 | 3,072 | 0.20% | 31 | 11 | 0.40% | 54 | 829 | 37.00% |
| Hawaii | 41 | 10,349 | 0.50% | 5 | -1,895 | -15.50% | 26 | -11,545 | -52.70% |
| Idaho | 52 | 1,413 | 0.10% | 47 | 127 | 9.90% | 2 | -7,194 | -83.60% |
| Illinois | 15 | 42,499 | 2.10% | 4 | -13,180 | -23.70% | 3 | -177,798 | -80.70% |
| Indiana | 10 | 52,078 | 2.60% | 51 | 6,824 | 15.10% | 53 | 641 | 1.20% |
| Iowa | 25 | 19,868 | 1.00% | 15 | -907 | -4.40% | 43 | -11,711 | -37.10% |
| Kansas | 35 | 14,693 | 0.70% | 43 | 1,046 | 7.70% | 42 | -9,097 | -38.20% |
| Kentucky | 19 | 34,738 | 1.70% | 22 | -815 | -2.30% | 28 | -36,526 | -51.30% |
| Louisiana | 22 | 23,091 | 1.10% | 14 | -1,068 | -4.40% | 5 | -44,376 | -65.80% |
| Maine | 42 | 9,345 | 0.50% | 28 | -73 | -0.80% | 25 | -10,662 | -53.30% |
| Maryland | 21 | 25,903 | 1.30% | 12 | -1,304 | -4.80% | 9 | -44,762 | -63.30% |
| Massachusetts | 12 | 48,356 | 2.40% | 46 | 4,014 | 9.10% | 38 | -36,344 | -42.90% |
| Michigan | 6 | 69,360 | 3.40% | 10 | -4,103 | -5.60% | 15 | -100,637 | -59.20% |
| Minnesota | 18 | 36,927 | 1.80% | 8 | -2,966 | -7.40% | 44 | -20,814 | -36.00% |
| Mississippi | 27 | 19,262 | 1.00% | 49 | 2,427 | 14.40% | 18 | -27,166 | -58.50% |
| Missouri | 14 | 43,712 | 2.20% | 19 | -1,473 | -3.30% | 36 | -36,411 | -45.40% |
| Montana | 45 | 5,823 | 0.30% | 48 | 598 | 11.40% | 40 | -4,291 | -42.40% |
| Nebraska | 40 | 10,611 | 0.50% | 44 | 816 | 8.30% | 51 | -3,824 | -26.50% |
| Nevada | 39 | 11,638 | 0.60% | 54 | 3,091 | 36.20% | 52 | -2,074 | -15.10% |
| New Hampshire | 44 | 6,149 | 0.30% | 39 | 363 | 6.30% | 48 | -2,951 | -32.40% |
| New Jersey | 16 | 41,268 | 2.00% | 11 | -2,112 | -4.90% | 14 | -60,436 | -59.40% |
| New Mexico | 31 | 16,623 | 0.80% | 13 | -815 | -4.70% | 30 | -16,730 | -50.20% |
| New York | 2 | 151,450 | 7.50% | 1 | -61,131 | -28.80% | 8 | -266,888 | -63.80% |
| North Carolina | 17 | 41,217 | 2.00% | 16 | -1,784 | -4.10% | 12 | -68,843 | -62.60% |
| North Dakota | 49 | 3,323 | 0.20% | 38 | 171 | 5.40% | 49 | -1,450 | -30.40% |
| Ohio | 4 | 83,523 | 4.10% | 32 | 577 | 0.70% | 16 | -120,717 | -59.10% |
| Oklahoma | 33 | 15,329 | 0.80% | 53 | 2,998 | 24.30% | 20 | -20,657 | -57.40% |
| Oregon | 29 | 17,967 | 0.90% | 45 | 1,436 | 8.70% | 41 | -11,950 | -39.90% |
| Pennsylvania | 5 | 78,766 | 3.90% | 17 | -3,167 | -3.90% | 19 | -107,576 | -57.70% |
| Puerto Rico | 28 | 18,578 | 0.90% | 3 | -6,456 | -25.80% | 10 | -31,293 | -62.70% |
| Rhode Island | 36 | 13,723 | 0.70% | 9 | -1,055 | -7.10% | 46 | -6,947 | -33.60% |
| South Carolina | 24 | 20,395 | 1.00% | 30 | -53 | -0.30% | 24 | -23,665 | -53.70% |
| South Dakota | 51 | 2,773 | 0.10% | 34 | 67 | 2.50% | 27 | -3,056 | -52.40% |
| Tennessee | 7 | 65,616 | 3.20% | 42 | 4,352 | 7.10% | 47 | -31,571 | -32.50% |
| Texas | 3 | 131,683 | 6.50% | 29 | -609 | -0.50% | 35 | -111,821 | -45.90% |
| Utah | 43 | 7,987 | 0.40% | 41 | 495 | 6.60% | 37 | -6,234 | -43.80% |
| Vermont | 48 | 5,022 | 0.20% | 20 | -143 | -2.80% | 39 | -3,743 | -42.70% |
| Virgin Islands | 53 | 474 | 0.00% | 2 | -190 | -28.60% | 6 | -897 | -65.40% |
| Virginia | 20 | 30,402 | 1.50% | 37 | 1,164 | 4.00% | 29 | -31,503 | -50.90% |
| Washington | 11 | 51,956 | 2.60% | 21 | -1,234 | -2.30% | 34 | -45,536 | -46.70% |
| West Virginia | 34 | 15,278 | 0.80% | 18 | -553 | -3.50% | 17 | -21,766 | -58.80% |
| Wisconsin | 26 | 19,395 | 1.00% | 36 | 721 | 3.90% | 11 | -32,529 | -62.60% |
| Wyoming | 54 | 416 | 0.00% | 7 | -62 | -13.00% | 1 | -3,896 | -90.40% |
Table B
Recipients - FY 2002
TANF and SSP Caseload Comparison
| State | Recipients at end of FY 2002 September 2002 |
Change Over FY 2002 September 2001 to September 2002 |
Change Since TANF Enactment August 1996 to September 2002 |
||||||
|---|---|---|---|---|---|---|---|---|---|
| Rank 1/ | Total | % of U.S. | Rank 2/ | Net Change 4/ | Rank 2/ | Net Change 4/ | |||
| U.S. Total | . | 5,540,050 | 100% | . | -135,538 | -2.40% | . | -7,245,138 | -59.20% |
| State & Terriroty TANF | . | 4,996,987 | 90.20% | . | -337,504 | -6.30% | . | -7,245,138 | -59.20% |
| SSP-MOE | . | 529,593 | 9.60% | . | 201,966 | 61.60% | . | - | - |
| All Tribal TANF 3/ | . | 13,470 | 0.20% | . | - | - | . | - | - |
| Alabama | 30 | 42,052 | 0.80% | 27 | -1,128 | -2.60% | 23 | -58,610 | -58.20% |
| Alaska | 45 | 15,940 | 0.30% | 30 | -382 | -2.30% | 30 | -19,604 | -55.20% |
| Arizona | 15 | 103,533 | 2.10% | 49 | 12,288 | 13.50% | 46 | -65,909 | -38.90% |
| Arkansas | 40 | 27,032 | 0.50% | 28 | -690 | -2.50% | 32 | -29,311 | -52.00% |
| California | 1 | 1,127,047 | 22.60% | 26 | -36,792 | -3.20% | 25 | -1,454,901 | -56.30% |
| Colorado | 37 | 32,458 | 0.60% | 52 | 4,643 | 16.70% | 12 | -63,330 | -66.10% |
| Connecticut | 25 | 50,243 | 1.00% | 7 | -9,667 | -16.10% | 9 | -109,003 | -68.40% |
| Delaware | 48 | 12,712 | 0.30% | 35 | 382 | 3.10% | 40 | -10,942 | -46.30% |
| Dist. of Col. | 31 | 41,503 | 0.80% | 29 | -1,049 | -2.50% | 44 | -27,789 | -40.10% |
| Florida | 11 | 120,867 | 2.40% | 23 | -4,662 | -3.70% | 5 | -412,934 | -77.40% |
| Georgia | 9 | 131,557 | 2.60% | 42 | 9,506 | 7.80% | 19 | -198,745 | -60.20% |
| Guam | 49 | 10,783 | 0.20% | 34 | 195 | 1.80% | 54 | 2,469 | 29.70% |
| Hawaii | 39 | 27,743 | 0.60% | 5 | -6,385 | -18.70% | 22 | -38,739 | -58.30% |
| Idaho | 52 | 2,496 | 0.00% | 48 | 273 | 12.30% | 3 | -19,284 | -88.50% |
| Illinois | 13 | 114,898 | 2.30% | 3 | -46,420 | -28.80% | 4 | -527,746 | -82.10% |
| Indiana | 8 | 147,263 | 2.90% | 51 | 20,249 | 15.90% | 53 | 4,659 | 3.30% |
| Iowa | 24 | 52,329 | 1.00% | 14 | -3,701 | -6.60% | 45 | -33,817 | -39.30% |
| Kansas | 35 | 37,948 | 0.80% | 44 | 3,187 | 9.20% | 43 | -25,835 | -40.50% |
| Kentucky | 19 | 76,843 | 1.50% | 22 | -3,277 | -4.10% | 28 | -95,350 | -55.40% |
| Louisiana | 22 | 58,770 | 1.20% | 17 | -3,429 | -5.50% | 6 | -169,345 | -74.20% |
| Maine | 42 | 24,596 | 0.50% | 24 | -823 | -3.20% | 31 | -29,277 | -54.30% |
| Maryland | 21 | 61,886 | 1.20% | 13 | -4,659 | -7.00% | 10 | -132,241 | -68.10% |
| Massachusetts | 12 | 115,643 | 2.30% | 47 | 11,704 | 11.30% | 34 | -110,387 | -48.80% |
| Michigan | 6 | 185,029 | 3.70% | 11 | -15,688 | -7.80% | 17 | -317,325 | -63.20% |
| Minnesota | 17 | 96,800 | 1.90% | 6 | -19,488 | -16.80% | 42 | -72,944 | -43.00% |
| Mississippi | 28 | 44,687 | 0.90% | 50 | 5,972 | 15.40% | 15 | -79,141 | -63.90% |
| Missouri | 14 | 114,175 | 2.30% | 20 | -5,683 | -4.70% | 35 | -108,645 | -48.80% |
| Montana | 44 | 16,313 | 0.30% | 46 | 1,561 | 10.60% | 41 | -12,817 | -44.00% |
| Nebraska | 41 | 26,109 | 0.50% | 40 | 1,765 | 7.30% | 50 | -13,119 | -33.40% |
| Nevada | 38 | 28,005 | 0.60% | 53 | 4,803 | 20.70% | 52 | -6,256 | -18.30% |
| New Hampshire | 46 | 14,702 | 0.30% | 39 | 916 | 6.60% | 47 | -8,235 | -35.90% |
| New Jersey | 16 | 100,286 | 2.00% | 12 | -7,705 | -7.10% | 16 | -175,351 | -63.60% |
| New Mexico | 29 | 44,383 | 0.90% | 9 | -5,400 | -10.80% | 27 | -55,278 | -55.50% |
| New York | 2 | 349,277 | 7.00% | 2 | -205,425 | -37.00% | 7 | -794,685 | -69.50% |
| North Carolina | 18 | 86,504 | 1.70% | 15 | -5,757 | -6.20% | 11 | -180,822 | -67.60% |
| North Dakota | 50 | 8,505 | 0.20% | 36 | 291 | 3.50% | 48 | -4,641 | -35.30% |
| Ohio | 5 | 186,827 | 3.70% | 31 | -3,632 | -1.90% | 13 | -362,485 | -66.00% |
| Oklahoma | 34 | 38,327 | 0.80% | 54 | 8,416 | 28.10% | 20 | -57,874 | -60.20% |
| Oregon | 32 | 40,911 | 0.80% | 45 | 3,692 | 9.90% | 37 | -37,508 | -47.80% |
| Pennsylvania | 4 | 205,220 | 4.10% | 25 | -6,820 | -3.20% | 18 | -325,839 | -61.40% |
| Puerto Rico | 23 | 54,333 | 1.10% | 4 | -17,281 | -24.10% | 14 | -96,690 | -64.00% |
| Rhode Island | 36 | 37,013 | 0.70% | 10 | -3,230 | -8.00% | 49 | -19,547 | -34.60% |
| South Carolina | 26 | 49,756 | 1.00% | 32 | -565 | -1.10% | 24 | -64,517 | -56.50% |
| South Dakota | 51 | 6,416 | 0.10% | 33 | 40 | 0.60% | 21 | -9,480 | -59.60% |
| Tennessee | 7 | 172,094 | 3.40% | 41 | 12,050 | 7.50% | 51 | -82,724 | -32.50% |
| Texas | 3 | 335,178 | 6.70% | 21 | -15,952 | -4.50% | 36 | -313,840 | -48.40% |
| Utah | 43 | 20,494 | 0.40% | 38 | 1,211 | 6.30% | 38 | -18,579 | -47.50% |
| Vermont | 47 | 13,068 | 0.30% | 18 | -722 | -5.20% | 39 | -11,263 | -46.30% |
| Virgin Islands | 54 | 334 | 0.00% | 1 | -2,042 | -85.90% | 2 | -4,564 | -93.20% |
| Virginia | 20 | 68,403 | 1.40% | 37 | 3,300 | 5.10% | 29 | -84,442 | -55.20% |
| Washington | 10 | 130,497 | 2.60% | 19 | -6,874 | -5.00% | 33 | -138,430 | -51.50% |
| West Virginia | 33 | 39,527 | 0.80% | 16 | -2,378 | -5.70% | 26 | -49,512 | -55.60% |
| Wisconsin | 27 | 46,930 | 0.90% | 43 | 3,899 | 9.10% | 8 | -101,958 | -68.50% |
| Wyoming | 53 | 742 | 0.00% | 8 | -141 | -16.00% | 1 | -10,656 | -93.50% |
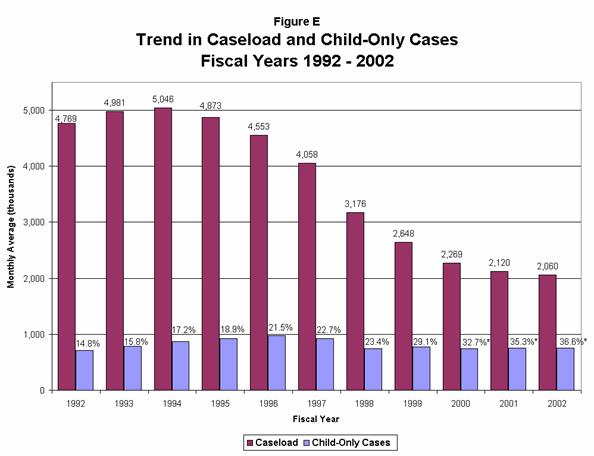
The TANF caseload includes a large and growing proportion of cases designated as "child-only" cases. Approximately 802,541 TANF cases receiving aid at the end of FY 2002 were families where no adult was included in the benefit calculation and only children were aided (Appendix Tables 10:5 & 10:12). Such child-only cases are exempted from Federal work requirements and time limits. As reflected in Figure E, the proportion of child-only cases in the caseload has been increasing over the last decade, growing from 14.8 percent in FY 1992 to 36.6 percent in FY 2002. The numerical size of the child-only caseload is not increasing, but has declined slightly and stabilized since 1996. The proportionate increase is due to the decline in adult-headed cases – a fact that makes dependency reduction among parent-headed families even more impressive.
Overall, two-fifths of the current total TANF caseload consists of families in which the parents of aided children are not receiving services or engaged in activities leading to self-sufficiency. Of these child-only cases, about half involve children living with a caretaker relative who has sufficient income not to receive assistance, about one-fifth are families in which the parent is disabled and receiving Supplemental Security Income, and approximately one-fifth are families in which the parent is ineligible for TANF because of his or her citizenship status. (See Appendix Table 10:12) As one would expect, child-only cases are much less likely to escape dependency through work. The increase in the proportion of child-only cases explains at least some of the recent leveling in the overall caseload.
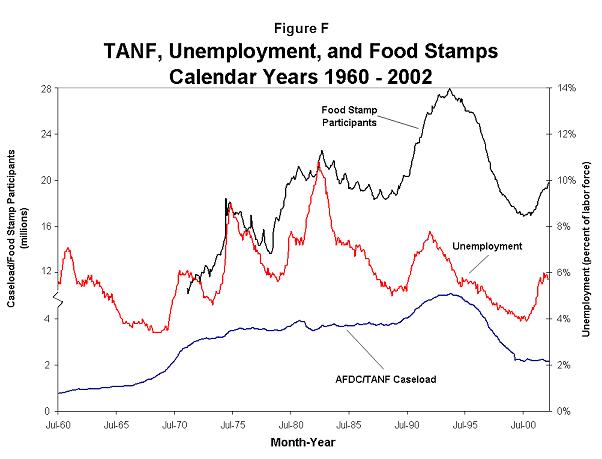
Dependency reduction reflected in the smaller caseload is particularly noteworthy because it continued through and after the national recession that occurred between March and November of 2001. During prior recessions, as the unemployment rate increased, the former Aid to Families with Dependent Children (AFDC) caseload also grew. But the increase was lagged, following the unemployment trend by about one year. Figure F shows that the pattern for TANF has not followed the former trend since this most recent recession.
It would be expected that job opportunities would decline as the economy slows. Why, then, have caseloads continued to decline and not expand significantly? One factor that may be contributing to the current trend is that the recent recession may have left employment in certain occupations, particularly entry-level jobs, relatively available. While certain sectors of the economy and certain parts of the country have been hard hit, opportunities still abound for many recipients seeking work. The Department of Labor's Bureau of Labor Statistics projects significant job growth over the next decade in many entry-level fields that require only short-term or moderate on-the-job training. Examples include personal and home care aides, medical assistants, home health aides, social and human service assistants, security guards, customer service representatives, retail sales, receptionists and information clerks, laborers, and interviewers. Because these are the primary types of jobs obtained by recipients who have been leaving welfare for work, opportunities still exist for those seeking employment.
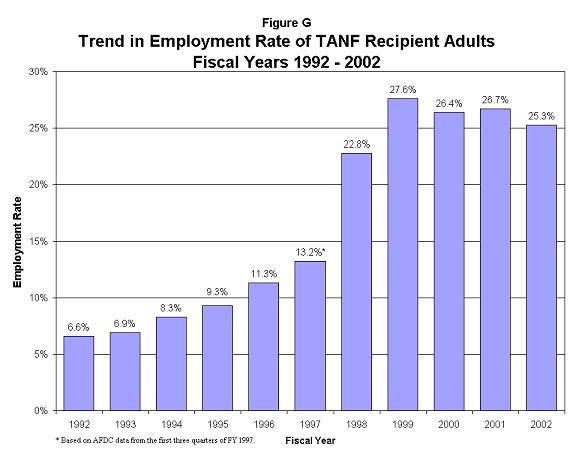
We do know that a much larger proportion of the current caseload is working than had been the case in the past, and this pattern has continued through FY 2002. Figure G shows that in FY 2002, 25 percent of TANF adult recipients were employed. This figure also illustrates the pattern of employment since FY 1992. While the recent recession and its particular characteristics have surely contributed to these caseload patterns, State work programs and eligibility policies may actually explain more.
It appears that welfare reform continues to be effective in sustaining TANF clients' connections to the workforce, even when overall unemployment has increased. June O'Ne ill and M. Anne Hill, in a March 2003 report titled “Gaining Ground, Moving Up: The Change in the Economic Status of Single Mothers Under Welfare Reform” provide remarkable evidence of how effective State policies and practices and the emphasis on work have been. They found that “increases in employment went hand in hand with the decline in welfare dependency – and that the 1996 reform played a major role in both trends, even after factoring in the effects of an expanding economy.” The proportion of working single mothers increased rapidly with welfare reform, the single largest factor for the rise, “accounting for more than 40 percent of the increase. Women who leave welfare are better off economically the longer they are off welfare, with increased wages and declines in poverty. The poverty rate among women who left welfare in 1996, for example, fell by about 50 percent in four years.” They conclude that women who have left welfare have substantially improved their life chances, and that “they are gaining ground and moving up the economic ladder.”
Importantly, States have been establishing increasingly effective job preparation and placement services for welfare families. Prior to the most recent recession, demand for entry-level workers greatly exceeded available supply in much of the nation. Many welfare-to-work programs report that while job opportunities have not been as robust as they were previously, these programs are still able to place clients who are prepared to take jobs. Even when the economy is sluggish, many recipients can find and obtain jobs if their welfare agencies keep them searching actively and building skills and work histories. The challenge for sustaining the success of welfare reform is to maintain its central attention on helping parents find and succeed in employment regardless of the economic environment.
State and local policy decisions and program management can greatly affect caseload levels and dynamics. States, and often counties, have great discretion over eligibility and benefit levels, work requirements, sanction procedures, time limits, diversion activities, post-employment supports, and case management techniques. All of these, along with the effectiveness of their implementation, can have a greater effect on caseload trends than general economic factors. However, the interrelationships of these variables make it nearly impossible to disaggregate the effects of each on the caseload. Below, we provide data reported by States on some of these variables.
TANF eligibility rules vary considerably from State to State. States set their own benefit levels and eligibility criteria, which usually are the same across the State (but some States vary by region). Nearly all States disregard some level of earnings when determining eligibility, and the amounts disregarded are often higher for those in the caseload than they are for those applying for aid. States do this to enable recipients who obtain employment while on welfare to continue receiving some cash aid while they are transitioning into work and toward higher levels of earnings. Table C outlines the cash benefit level and general eligibility thresholds for each State during FY 2002.
Table C
TANF Benefits and Eligibility for a Family of Three
July, 2002
|
State |
Maximum Monthly Benefit * | Maximum Monthly Income for Eligibility | Maximum Monthly Income for Benefits ** |
|---|---|---|---|
|
Alabama |
$ 164 | $ 204 | $ 205 |
|
Alaska |
$ 923 | $ 1,245 | $ 1,246 |
|
Arizona |
$ 347 | $ 585 | $ 587 |
|
Arkansas |
$ 204 | $ 278 | $ 699 |
|
California |
$ 679 | $ 913 | $ 1,581 |
|
Colorado |
$ 356 | $ 510 | $ 779 |
|
Connecticut |
$ 543 | $ 834 | $ 1,220 |
|
D.C. |
$ 379 | $ 538 | $ 1,299 |
|
Delaware |
$ 338 | $ 427 | $ 1,604 |
|
Florida |
$ 303 | $ 392 | $ 807 |
|
Georgia |
$ 280 | $ 513 | $ 756 |
|
Hawaii |
$ 570 | $ 1,362 | $ 1,364 |
|
Idaho |
$ 293 | $ 635 | $ 637 |
|
Illinois |
$ 377 | $ 466 | $ 1,133 |
|
Indiana |
$ 288 | $ 591 | $ 1,948 |
|
Iowa |
$ 426 | $ 1,061 | $ 1,065 |
|
Kansas |
$ 403 | $ 518 | $ 805 |
|
Kentucky |
$ 262 | $ 973 | $ 974 |
|
Louisiana |
$ 240 | $ 359 | $ 1,260 |
|
Maine |
$ 485 | $ 1,022 | $ 1,023 |
|
Maryland |
$ 472 | $ 589 | $ 725 |
|
Massachusetts |
$ 633 | $ 707 | $ 1,047 |
|
Michigan |
$ 459 | $ 773 | $ 774 |
|
Minnesota |
$ 532 | $ 976 | $ 1,421 |
|
Mississippi |
$ 170 | $ 457 | $ 704 |
|
Missouri |
$ 292 | $ 558 | $ 1,148 |
|
Montana |
$ 494 | $ 858 | $ 589 |
|
Nebraska |
$ 364 | $ 692 | $ 694 |
|
Nevada |
$ 348 | $ 694 | $ 696 |
|
New Hampshire |
$ 600 | $ 749 | $ 1,200 |
|
New Jersey |
$ 424 | $ 635 | $ 848 |
|
New Mexico |
$ 439 | $ 901 | $ 1,037 |
|
New York |
$ 577 | $ 810 | $ 1,068 |
|
North Carolina |
$ 272 | $ 1,489 | $ 1,491 |
|
North Dakota |
$ 477 | $ 2,071 | $ 2,074 |
|
Ohio |
$ 373 | $ 979 | $ 996 |
|
Oklahoma |
$ 292 | $ 704 | $ 705 |
|
Oregon |
$ 460 | $ 615 | $ 616 |
|
Pennsylvania |
$ 403 | $ 676 | $ 806 |
|
Rhode Island |
$ 554 | $ 1,277 | $ 1,279 |
|
South Carolina |
$ 204 | $ 577 | $ 1,070 |
|
South Dakota |
$ 469 | $ 675 | $ 677 |
|
Tennessee |
$ 185 | $ 979 | $ 980 |
|
Texas |
$ 208 | $ 416 | $ 1,959 |
|
Utah |
$ 474 | $ 573 | $ 668 |
|
Vermont |
$ 629 | $ 988 | $ 989 |
|
Virginia |
$ 320 | $ 411 | $ 600 |
|
Washington |
$ 546 | $ 1,091 | $ 1,092 |
|
West Virginia |
$ 453 | $ 1,130 | $ 1,133 |
|
Wisconsin |
$ 673 | $ 1,401 | $ 1,403 |
|
Wyoming |
$ 340 | $ 539 | $ 540 |
| $ 412 | $ 773 | $ 1,020 |
| * Benefit levels and income standards based on family size of 3. | |||
| ** Several states phase-down earnings disregard levels in months after employment is obtained. |
Eligibility changes can have large impacts on caseload levels and trends. Indiana's caseload decreased 32 percent between August of 1996 and June of 2000. However, after expanding its earnings disregard, the number of recipients increased by 52 percent between June and September of 2002, resulting in a caseload level 3.3 percent larger than when TANF was enacted. Most States have increased earnings disregards and/or benefit levels since TANF's enactment, although the degree of changes and their impact on State caseloads was far less than that experienced in Indiana. Appendix Table 12:5 shows the earnings disregards for all States during FY 2002.
Although caseloads during FY 2002 suggest a static caseload over time, the families that comprise the caseload change considerably on a monthly basis. Critical to understanding the TANF program and the tremendous achievement of States is the dynamic nature of the caseload. Figure H shows the average monthly number of new cases opened (applications approved) and cases closed over three recent fiscal years.
During this three-year period from FY 2000 through FY 2002, States approved between 129,339 and 182,399 applications each month. In FY 2002, States approved an average of 159,597 cases each month for a total of 1,915,159 during the year. During the year, 170,017 cases were closed each month for a total of 2,040,208 case closures. (See Appendix Table 1:13 for the detailed State information.)
The average length of TANF assistance received by families in FY 2002 was 29 months, up from 25 months in FY 2000. Again, there is considerable State variation, ranging from an average of six months in Idaho to an average of 38 months in the District of Columbia. Appendix Table 10:43 shows this breakdown by State. These data show how rapidly many families go on and off assistance, and illustrate the amount of work involved by line staff to establish eligibility, provide benefits, assess family needs, and schedule and monitor services and activities leading to independence.
PRWORA established a five-year lifetime limit on receipt of Federal TANF assistance for adult-headed families, but allowed States to exempt from this limit for hardship reasons up to 20 percent of their total caseload. The time limit was central to establishing the temporary nature of aid and communicating the program's goal to move recipients quickly into work and off of welfare. The time limit was controversial at the time, with some critics predicting massive escalations in hunger and homelessness for these families, and arguing that the 20 percent hardship exception would be inadequate to address the number of families needing exceptions or extensions.
Federal time limit clocks began once States had established their new TANF programs, the first beginning in September 1996 and the last States in July 1997. Thus, FY 2002 was the first year in which the Federal five-year lifetime limit may have been reached by a TANF family in every State, if they had received assistance continuously since the State implemented the TANF program. Case closure data for 33 States show that less than one half of one percent of cases have been closed due to the five-year limitation during the year (see Appendix Table 10:48). The remaining States reported closing nearly 44,600 cases that had reached the Federal lifetime limit. Ninety-two percent of these cases were in three States – New York, Puerto Rico and Hawaii. New York closed a little over 38,000 cases, 86 percent of the national total. But, while these cases were closed from the TANF program, nearly all were reopened under New York's “Safety Net Assistance” program funded through Maintenance of Effort (MOE) separate State funds. Puerto Rico closed nearly 1,300 cases and Hawaii closed over 1,200. In total, considering New York's conversion of cases, less than 7,000 cases were closed due to Federal time limits during the first year in which they began to apply in all states.
Nationally, only 1.1 percent of families are receiving Federal assistance beyond the five-year limitation, far below the 20 percent allowed. Forty-two States report less than one percent as hardship exemptions. Five States have between five and ten percent of cases in hardship status, and no State had more than ten percent of their families receiving assistance beyond five years in hardship status. This means that States have substantial leeway to continue to provide assistance to families facing hardships once they reach the lifetime limit, if a State so chooses.
There are three major reasons why so few families have been affected by Federal time limits. The first, and by far most important, is that welfare reforms have been tremendously effective at helping families move off of welfare long before most reach their time limit. Note from above that only two percent of the more than two million case closings in FY 2002 were due to families meeting Federal time limits.
Second, nearly 41 percent of cases are exempt from the accrual of months for a variety of reasons: the case does not contain a countable head-of-household, assistance is State-funded, the family is exempt under an approved welfare waiver, or the family lives in Indian country or an Alaska native village with high unemployment. Finally, most families do not receive assistance continuously. Forty-three percent of cases on assistance in FY 2002 that were subject to the Federal time limit are in the first year of assistance, 20 percent in the second year, 13 percent in the third year, and 22 percent in the fourth year. States may also establish shorter time limits than five years, and 19 States do so (See Appendix Table 12:10). During FY 2002, States reported closing over 16,000 cases due to State time limits, in addition to those closed due to the Federal time limit. This compares to nearly 18,000 in FY 2001 and 24,000 cases in FY 2000.
Time limits have proven to be a crucial part of TANF's effectiveness. The message that assistance is temporary is an important part of how States help parents take advantage of the opportunities for work and independence. Perhaps more importantly, time limit policies have spurred welfare agencies and their staff to focus case management on families who are spending long periods of time on TANF, just as these policies intended.
Reducing financial benefits for those who do not comply with program requirements is crucial to making the requirements of welfare to work programs meaningful and effective. States vary considerably in their benefit reduction, or sanction, policies and implementation practices and these differences can have significant effects on caseload dynamics. Sanction policies can apply to a range of program requirements including: eligibility rules, job search, work or other participation requirements, cooperation with child support enforcement, teen school attendance, and other issues.
Sanctions can impact caseloads in different ways. Thirty-six States impose “full-check” sanctions (either for initial or after repeated non-compliance) making a family's full assistance grant contingent upon program compliance, and effectively closing a case when a sanction is imposed. In other States where only a portion of an assistance check is reduced if a family is sanctioned, such a case would remain open. Finally, many States require participation in job search and job preparation activities during the application process and failure to comply can result in not opening a case. While the latter situation is usually not referred to as a sanction, it operates like a full-check sanction and can significantly impact caseload dynamics.
Thirty States operated separate cash benefit programs, funded without Federal dollars, and claim expenditures from these programs toward their TANF MOE requirements. Such programs are not subject to general TANF requirements, but in order to be claimed as MOE expenditures, the funds must be spent on families that include a child living with a parent or adult caretaker relative and are financially eligible according to State-set income/resource standards.
States have expanded the number of clients served under SSPs during the past three years. The 30 States with SSPs aided an average of 128,456 families during FY 2002. Twenty-seven of these States use SSPs to aid some or all two-parent families who are then not subject to the TANF two-parent participation requirements. Other SSPs cover families who have exhausted their Federal TANF time limits, or which include disabled family members or domestic violence victims. Some SSPs provide assistance to non-citizen families who are not eligible for Federal public benefits or provide food assistance through the alternative Food Stamp program.
This document was last modified on
May-29-2008
.