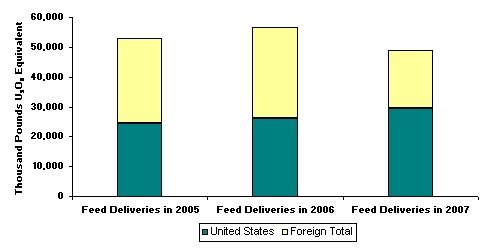
Table 13. Deliveries of Uranium Feed by Owners and Operators of U.S. Civilian Nuclear Power Reactors by Enrichment Country and Delivery Year, 2005-2007
(Thousand Pounds U3O8 Equivalent) |
| Enrichment Country |
Feed Deliveries in 2005 |
Feed Deliveries in 2006 |
Feed Deliveries in 2007 |
| U.S.-Origin |
Foreign-Origin |
Total |
U.S.-Origin |
Foreign-Origin |
Total |
U.S.-Origin |
Foreign-Origin |
Total |
| China |
0 |
W |
W |
0 |
0 |
0 |
0 |
0 |
0 |
| France |
W |
W |
9,639 |
109 |
7,591 |
7,699 |
0 |
3,067 |
3,067 |
| Germany |
0 |
W |
W |
0 |
1,456 |
1,456 |
W |
W |
W |
| Netherlands |
0 |
1,472 |
1,472 |
0 |
2,851 |
2,851 |
0 |
3,223 |
3,223 |
| Russia |
W |
W |
2,451 |
0 |
W |
W |
0 |
0 |
0 |
| United Kingdom |
W |
W |
4,443 |
254 |
6,965 |
7,219 |
W |
W |
2,862 |
| Europe [1] |
W |
W |
6,945 |
0 |
8,404 |
8,404 |
W |
W |
8,273 |
| Other [2] |
W |
W |
W |
0 |
W |
W |
0 |
W |
W |
| Foreign Total |
908 |
27,483 |
28,391 |
363 |
29,963 |
30,326 |
479 |
18,943 |
19,421 |
| United States |
8,220 |
16,276 |
24,496 |
4,659 |
21,594 |
26,253 |
3,033 |
26,566 |
29,599 |
| Total |
9,128 |
43,759 |
52,887 |
5,021 |
51,557 |
56,578 |
3,512 |
45,508 |
49,020 |
|