| OFFICE OF THE INSPECTOR
GENERAL 1989 - 2003 |
|||||||||||||
| FISCAL YEAR | POSITIONS | BUDGET (Millions) |
CPI INDEXED TO 1993 |
BUDGET IN 1993 $ (Millions) |
BUDGET REAL PERCENT GROWTH FROM 1993 |
BUDGET APPARENT PERCENT GROWTH FROM 1993 |
|||||||
|---|---|---|---|---|---|---|---|---|---|---|---|---|---|
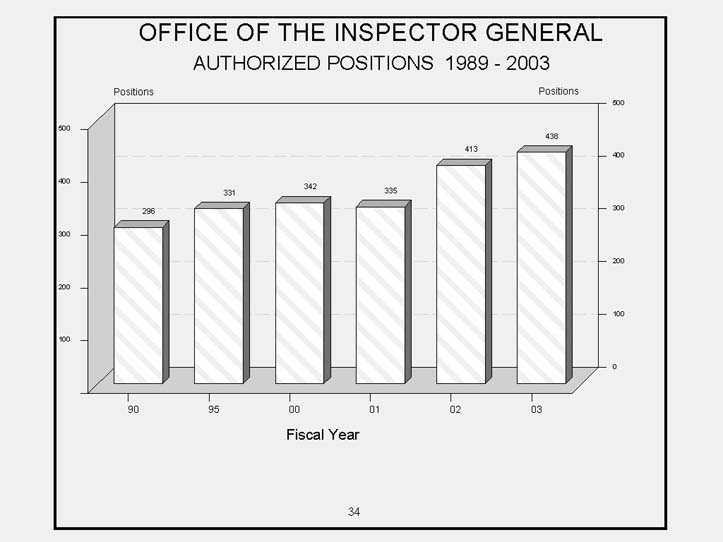
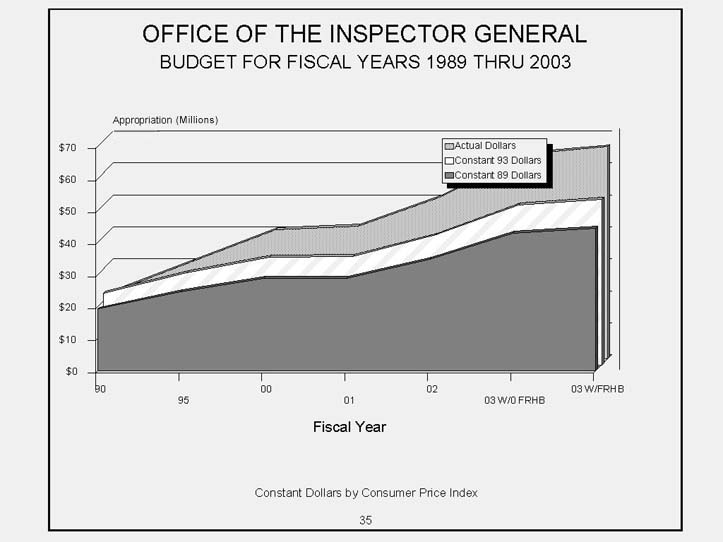
| 1989 | 296 | 18.8 | * | 85.9 | 21.9 | -28.5 | -38.6 | ||||||
| 1990 | 296 | 20.5 | 91.2 | 22.4 | -26.7 | -33.2 | |||||||
| 1991 | 336 | 25.1 | 94.5 | 26.6 | -13.2 | -17.9 | |||||||
| 1992 | 348 | 28.8 | 97.4 | 29.6 | -3.3 | -5.9 | |||||||
| 1993 | 344 | 30.6 | 100.0 | 30.6 | 0.0 | 0.0 | |||||||
| 1994 | 335 | 30.0 | 103.0 | 29.1 | -4.9 | -2.0 | |||||||
| 1995 | 331 | 30.5 | 105.6 | 28.9 | -5.7 | -0.4 | |||||||
| 1996 | @ | 325 | 31.4 | 108.7 | 28.9 | -5.7 | 2.5 | ||||||
| 1997 | # | 326 | 32.0 | 111.1 | 28.8 | -6.0 | 4.5 | ||||||
| 1998 | # | 326 | 33.4 | 112.8 | 29.6 | -3.4 | 8.9 | ||||||
| 1999 | # Y | 326 | 37.7 | 115.7 | 32.6 | 6.4 | 23.1 | ||||||
| 2000 | # | 342 | 40.3 | 119.8 | 33.6 | 9.9 | 31.6 | ||||||
| 2001 | # R | 335 | 41.5 | 122.9 | 33.8 | 10.3 | 35.6 | ||||||
| 2002 | 413 | 50.7 | 125.1 | 40.6 | 32.4 | 65.7 | |||||||
| 2003 W/O FRHB | 438 | 63.9 | 127.9 | 50.0 | 63.2 | 108.7 | |||||||
| 2003 W/ FRHB | 438 | 66.3 | 127.9 | 51.8 | 69.3 | 116.5 | |||||||
| OFFICE OF THE INSPECTOR
GENERAL 1989 - 2003 |
|||||||||||||
| FISCAL YEAR | POSITIONS | BUDGET (Millions) |
CPI INDEXED TO 1989 |
BUDGET IN 1989 $ (Millions) |
BUDGET REAL PERCENT GROWTH FROM 1989 |
BUDGET APPARENT PERCENT GROWTH FROM 1989 |
|||||||
|---|---|---|---|---|---|---|---|---|---|---|---|---|---|
| 1989 | 296 | 18.8 | * | 100 | 18.8 | 0.0 | 0.0 | ||||||
| 1990 | 296 | 20.5 | 106.1 | 19.3 | 2.5 | 8.8 | |||||||
| 1991 | 336 | 25.1 | 110.0 | 22.8 | 21.5 | 33.7 | |||||||
| 1992 | 348 | 28.8 | 113.3 | 25.4 | 35.3 | 53.3 | |||||||
| 1993 | 344 | 30.6 | 116.4 | 26.3 | 40.0 | 62.9 | |||||||
| 1994 | 335 | 30.0 | 119.9 | 25.0 | 33.1 | 59.6 | |||||||
| 1995 | 331 | 30.5 | 122.9 | 24.8 | 32.0 | 62.2 | |||||||
| 1996 | @ | 325 | 31.4 | 126.6 | 24.8 | 32.0 | 67.0 | ||||||
| 1997 | # | 326 | 32.0 | 129.3 | 24.7 | 31.5 | 70.1 | ||||||
| 1998 | # | 326 | 33.4 | 131.3 | 25.4 | 35.2 | 77.4 | ||||||
| 1999 | # Y | 326 | 37.7 | 134.7 | 28.0 | 48.9 | 100.5 | ||||||
| 2000 | # | 342 | 40.3 | 139.4 | 28.9 | 53.8 | 114.4 | ||||||
| 2001 | # R | 335 | 41.5 | 143.0 | 29.0 | 54.4 | 120.9 | ||||||
| 2002 | 413 | 50.7 | 145.6 | 34.8 | 85.3 | 169.9 | |||||||
| 2003 W/O FRHB | 438 | 63.9 | 148.8 | 42.9 | 40.2 | 108.7 | |||||||
| 2003 W/ FRHB | 438 | 66.3 | 148.8 | 44.6 | 45.5 | 116.5 | |||||||