| IMMIGRATION AND NATURALIZATION
SERVICE BUDGET 1975 - 2003 |
|||||||||||||
| FISCAL YEAR |
POSITIONS | INS BUDGET (Millions) |
CPI INDEXED TO 1993 |
INS
BUDGET IN 1993 $ (Millions) |
INS BUDGET REAL PERCENT GROWTH FROM 1993 |
INS BUDGET APPARENT PERCENT GROWTH FROM 1993 |
|||||||
|---|---|---|---|---|---|---|---|---|---|---|---|---|---|
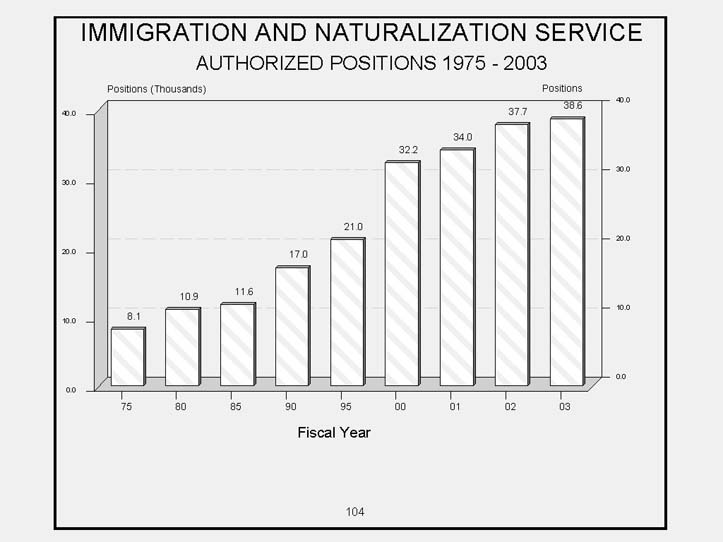
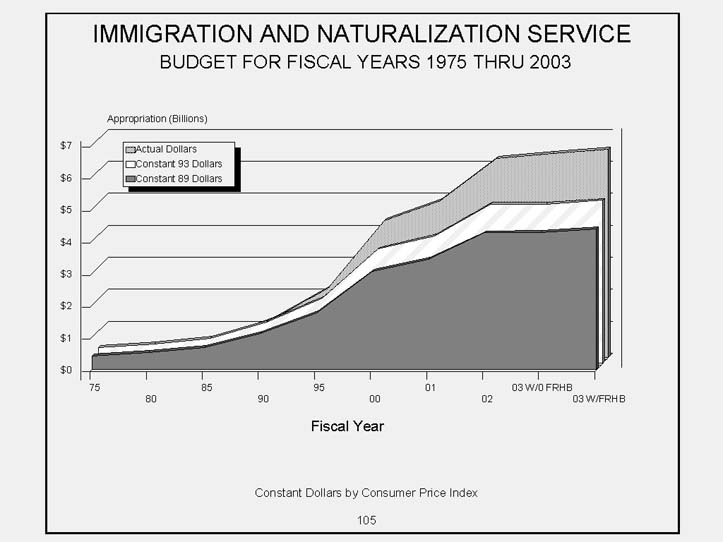
| 1975 | 8,082 | $181.3 | 37.4 | $484.7 | -68.4 | -88.2 | |||||||
| 1976 | 8,832 | 214.6 | 39.6 | 542.5 | -64.6 | -86.0 | |||||||
| 1977 | 9,473 | 244.5 | 42.1 | 580.6 | -62.1 | -84.1 | |||||||
| 1978 | 10,071 | 283.1 | 45.3 | 624.4 | -59.3 | -81.5 | |||||||
| 1979 | 10,997 | 309.3 | 50.4 | 613.2 | -60.0 | -79.8 | |||||||
| 1980 | 10,943 | 349.1 | 57.3 | 609.6 | -60.2 | -77.2 | |||||||
| 1981 | 10,886 | 371.5 | 63.2 | 587.8 | -61.7 | -75.8 | |||||||
| 1982 | 10,604 | 444.4 | 67.1 | 662.5 | -56.8 | -71.0 | |||||||
| 1983 | 10,483 | 495.7 | 69.2 | 715.9 | -53.3 | -67.7 | |||||||
| 1984 | 10,601 | 510.6 | 72.2 | 707.4 | -53.9 | -66.7 | |||||||
| 1985 | 11,649 | 585.0 | 74.8 | 782.5 | -49.0 | -61.8 | |||||||
| 1986 | 11,694 | 574.7 | 76.2 | 754.2 | -50.8 | -62.5 | |||||||
| 1987 | 17,544 | 902.5 | 79.0 | 1,142.6 | -25.5 | -41.1 | |||||||
| 1988 | 17,742 | 1,010.3 | 82.1 | 1,229.9 | -19.8 | -34.1 | |||||||
| 1989 | 18,505 | 1,085.3 | 85.9 | 1,263.1 | -17.6 | -29.2 | |||||||
| 1990 | * @ | 17,010 | 1,183.5 | 91.2 | 1,298.3 | -15.3 | -22.8 | ||||||
| 1991 | * | 17,187 | 1,270.5 | 94.5 | 1,344.0 | -12.3 | -17.1 | ||||||
| 1992 | * | 17,676 | 1,458.5 | 97.4 | 1,497.8 | -2.3 | -4.9 | ||||||
| 1993 | * # | 18,417 | 1,533.3 | 100.0 | 1,533.3 | 0.0 | 0.0 | ||||||
| 1994 | * $ @ & | 18,622 | 1,586.2 | 103.0 | 1,540.0 | 0.4 | 3.5 | ||||||
| 1995 | * V @ & | 21,048 | 2,158.7 | 105.6 | 2,044.7 | 33.4 | 40.8 | ||||||
| 1996 | * V & | 24,704 | 2,600.2 | 108.7 | 2,391.2 | 55.9 | 69.6 | ||||||
| 1997 | * V & | 26,123 | 3,132.7 | 111.1 | 2,818.8 | 83.8 | 104.3 | ||||||
| 1998 | * V & | 29,349 | 3,688.2 | 112.8 | 3,269.7 | 113.2 | 140.5 | ||||||
| 1999 | * V Y & | 31,502 | 4,001.7 | 115.7 | 3,457.7 | 125.5 | 161.0 | ||||||
| 2000 | * V & R | 32,187 | 4,277.3 | 119.8 | 3,570.8 | 132.9 | 179.0 | ||||||
| 2001 | * & R | 33,990 | 4,902.0 | 122.9 | 3,988.6 | 160.1 | 219.7 | ||||||
| 2002 | * C | 37,698 | 6,208.2 | 125.1 | 4,962.1 | 223.6 | 304.9 | ||||||
| 2003 W/O FRHB | * | 38,574 | 6359.8 | 127.9 | 4,973.9 | 224.4 | 314.8 | ||||||
| 2003 W/ FRHB | * | 38,574 | 6511.4 | 127.9 | 5,091.0 | 232.0 | 324.7 | ||||||
| IMMIGRATION AND NATURALIZATION
SERVICE BUDGET 1975 - 2003 |
|||||||||||||
| FISCAL YEAR | POSITIONS | INS BUDGET (Millions) |
CPI INDEXED TO 1989 |
INS BUDGET IN 1989 $ (Millions) |
INS BUDGET REAL PERCENT GROWTH FROM 1989 |
INS BUDGET APPARENT PERCENT GROWTH FROM 1989 |
|||||||
|---|---|---|---|---|---|---|---|---|---|---|---|---|---|
| 1975 | 8,082 | $181.3 | 43.5 | $416.5 | -61.6 | -83.3 | |||||||
| 1976 | 8,832 | 214.6 | 46.0 | 466.1 | -57.1 | -80.2 | |||||||
| 1977 | 9,473 | 244.5 | 49.0 | 498.8 | -54.0 | -77.5 | |||||||
| 1978 | 10,071 | 283.1 | 52.8 | 536.5 | -50.6 | -73.9 | |||||||
| 1979 | 10,997 | 309.3 | 58.7 | 526.8 | -51.5 | -71.5 | |||||||
| 1980 | 10,943 | 349.1 | 66.6 | 523.8 | -51.7 | -67.8 | |||||||
| 1981 | 10,886 | 371.5 | 73.6 | 505.0 | -53.5 | -65.8 | |||||||
| 1982 | 10,604 | 444.4 | 78.1 | 569.2 | -47.6 | -59.1 | |||||||
| 1983 | 10,483 | 495.7 | 80.6 | 615.1 | -43.3 | -54.3 | |||||||
| 1984 | 10,601 | 510.6 | 84.0 | 607.8 | -44.0 | -53.0 | |||||||
| 1985 | 11,649 | 585.0 | 87.0 | 672.3 | -38.1 | -46.1 | |||||||
| 1986 | 11,694 | 574.7 | 88.7 | 648.0 | -40.3 | -47.0 | |||||||
| 1987 | 17,544 | 902.5 | 91.9 | 981.7 | -9.5 | -16.8 | |||||||
| 1988 | 17,742 | 1,010.3 | 95.6 | 1,056.8 | -2.6 | -6.9 | |||||||
| 1989 | 18,505 | 1,085.3 | 100.0 | 1,085.3 | 0.0 | 0.0 | |||||||
| 1990 | * @ | 17,010 | 1,183.5 | 106.1 | 1,115.5 | 2.8 | 9.1 | ||||||
| 1991 | * | 17,187 | 1,270.5 | 110.0 | 1,154.7 | 6.4 | 17.1 | ||||||
| 1992 | * | 17,676 | 1,458.5 | 113.3 | 1,286.9 | 18.6 | 34.4 | ||||||
| 1993 | * # | 18,417 | 1,533.3 | 116.4 | 1,317.4 | 21.4 | 41.3 | ||||||
| 1994 | * $ @ & | 18,622 | 1,586.2 | 119.9 | 1,323.2 | 21.9 | 46.2 | ||||||
| 1995 | * V @ & | 21,048 | 2,158.7 | 122.9 | 1,756.8 | 61.9 | 98.9 | ||||||
| 1996 | * V & | 24,704 | 2,600.2 | 126.6 | 2,054.5 | 89.3 | 139.6 | ||||||
| 1997 | * V & | 26,123 | 3,132.7 | 129.3 | 2,422.0 | 123.2 | 188.6 | ||||||
| 1998 | * V & | 29,349 | 3,688.2 | 131.3 | 2,809.3 | 158.9 | 239.8 | ||||||
| 1999 | * V Y & | 31,502 | 4,001.7 | 134.7 | 2,970.8 | 173.7 | 268.7 | ||||||
| 2000 | * V & R | 32,187 | 4,277.3 | 139.4 | 3,068.1 | 182.7 | 294.1 | ||||||
| 2001 | * & R | 33,990 | 4,902.0 | 143.0 | 3,427.1 | 215.8 | 351.7 | ||||||
| 2002 | * C | 37,698 | 6,208.2 | 145.6 | 4,263.5 | 292.8 | 472.0 | ||||||
| 2003 W/O FRHB | * | 38,574 | 6359.8 | 148.8 | 4,273.6 | 293.8 | 486.0 | ||||||
| 2003 W/ FRHB | * | 38,574 | 6511.4 | 148.8 | 4,375.9 | 303.2 | 500.0 | ||||||
| IMMIGRATION AND NATURALIZATION SERVICE
BUDGET (FEES) 1975-2003 (IN THOUSANDS OF DOLLARS) During the same period positions include FTE reimbursed from the Fee accounts in addition to the directly appropriated positions. |
||||||||||||
| YEAR | INS USER | INS LEGALIZATION | INS EXAMS | LAND BORDER INSPECTIONS |
BREACHED BOND AND DETENTION FUND |
ENFORCEMENT FINES |
H-1B | TOTAL | ||||
|---|---|---|---|---|---|---|---|---|---|---|---|---|
| 1987 | $58,889 | $97,994 | $156,883 | |||||||||
| 1988 | 91,707 | 189,279 | 280,986 | |||||||||
| 1989 | 108,456 | 63,889 | $90,939 | 263,284 | ||||||||
| 1990 | 114,128 | 60,791 | 123,269 | 298,188 | ||||||||
| 1991 | 152,070 | 29,298 | 182,406 | $10 | 363,784 | |||||||
| 1992 | 198,058 | 17,137 | 260,659 | 169 | $10,454 | 486,477 | ||||||
| 1993 | 216,647 | 7,631 | 299,795 | 241 | $9,587 | 10,454 | 544,355 | |||||
| 1994 | 257,669 | 2,792 | 235,888 | 547 | 8,183 | 7,367 | 512,446 | |||||
| 1995 | 319,255 | 3,482 | 378,671 | 1,584 | 7,959 | 0 | 710,951 | |||||
| 1996 | 317,470 | 1,444 | 521,864 | 937 | 10,022 | 2,281 | 854,018 | |||||
| 1997 | 361,687 | 1,470 | 638,254 | 1,347 | 2,361 | ** | 0 | 1,005,119 | ||||
| 1998 | 411,700 | 1,259 | 717,426 | 1,897 | 196,832 | 3,799 | 1,332,913 | |||||
| 1999 | 502,404 | 656,884 | 3,381 | 178,496 | 4,050 | 1,125 | 1,346,340 | |||||
| 2000 | 453,458 | 745,500 | 1,548 | 77,684 | 5,510 | 1,125 | 1,284,825 | |||||
| 2001 | 494,384 | 1,051,144 | 1,670 | 80,600 | 1,850 | 2,446 | 1,632,094 | |||||
| 2002 | 591,866 | 1,376,871 | 4,490 | 120,763 | 22,664 | 26,272 | 2,142,926 | |||||
| 2003 W/O FRHB | 658,295 | 1,462,803 | 2,700 | 171,275 | 6,000 | 10,000 | 2,311,073 | |||||
| 2003 W/ FRHB | 677,753 | 1,494,888 | 2,799 | 171,539 | 6,000 | 10,264 | 2,363,243 | |||||
| Page 108 | ||||||||||||