
USGS Educational Resources
Alaska and the Arctic | Antarctica | Climate Change | Glaciers and Ice | Photographs | Satellite Imagery | Wildlife | Other USGS Resources | Printable version of this list
Click topic headings for more information.
Alaska and the Arctic
Alaska Energy Information
| What is it? | What Can I Do With It? | What Does It Look Like? |
|---|---|---|
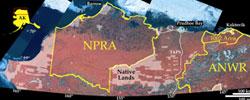
The north slope of Alaska is a major petroleum province and holds significant potential for energy resources that are unmatched by any other onshore region of the United States The goal of USGS energy resource assessments is to provide Congress, the Administration and the public an estimate of how much oil and gas remains to be discovered—the USGS has several energy–related efforts currently under way in Alaska. |
Use these studies to explore a wealth of subsurface geologic information, as well as outlines of the known petroleum fields and coal mines. Also, examine studies offering rigorous examples of a scientific–based, economic energy forecasts that involve uncertainty. Learn more… |
 |
Alaska Wildlife
| What is it? | What Can I Do With It? | What Does It Look Like? |
|---|---|---|
Scientists at the Alaska Science Center study a wide range of arctic wildlife, including bears, caribou, moose, polar bears, sea otters, sheep, walrus, wolves, fish, and birds. |
See how scientists work in this extreme environment, collecting data and making observations about arctic wildlife. Find out the latest information the USGS is learning about arctic ecosystems and their response to global change. Learn more…. |
 |
Arctic Refuge Coastal Plain Terrestrial Wildlife Research Summaries
(Biological Science Report USGS /BRD/BSR-2002-0001, 1988–1994)
| What is it? | What Can I Do With It? | What Does It Look Like? |
|---|---|---|
First established in 1960, the Arctic National Wildlife Refuge was expanded in 1980. This report is in response to that year´s legislation, which designated almost all of the original Arctic National Wildlife Range as wilderness and directed the Secretary of the Interior to conduct studies evaluating both the biological resources and the potential petroleum reserves of 1.5 million acres on the coastal plain of the Arctic Refuge (the “1002 Area”). |
Use this extensive and well–illustrated report to investigate population dynamics, distribution, energetics, and habitat use of key wildlife species. Also read discussions about potential effects and mitigation of petroleum development on wildlife and habitats. Learn more… |
 |
Arctic National Wildlife Refuge (ANWR) Earth and Biological Science Data
| What is it? | What Can I Do With It? | What Does It Look Like? |
|---|---|---|
This is a library of a variety of base maps and statistical data on ANWR. |
Use this site for earth and biological investigations of the Arctic National Wildlife Refuge. Learn more… |
 |
Alaska Maps on Demand
| What is it? | What Can I Do With It? | What Does It Look Like? |
|---|---|---|
Using print–on–demand technology, the USGS is implementing map–on–demand (MOD) printing for selected infrequently requested map products. By providing MOD products, the USGS can provide an alternative to traditional large–volume printing; it can also improve its responsiveness to customers by providing access to USGS scientific data that otherwise might not be available. |
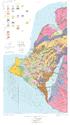
Use this site to access to dozens of maps of Alaska that are not currently available “off the shelf” but can be printed on demand for the cost of printing. Maps at several scales are available of Alaskan geology, minerals resources, fossils, surficial materials, glacial features, sedimentary basins, gravity measurements, and of groundwater levels. Learn more… |
 |
Permafrost Monitoring
| What is it? | What Can I Do With It? | What Does It Look Like? |
|---|---|---|
The U.S. Department of the Interior's DOI permafrost network in Alaska is part of a global network of permafrost monitoring stations that monitor for changes in the solid–earth component of the Earth's cryosphere. |
Use this Web resource to understand how permafrost is monitored and why it is important in polar research. Learn more… |
 |
Real-Time Water Data
| What is it? | What Can I Do With It? | What Does It Look Like? |
|---|---|---|
The network of thousands of USGS gaging stations in Alaska and elsewhere in the United States offers real–time and historic streamflow, water quality, groundwater, lake levels, and other hydrologic information in graph and tabular form. |
How much water flowed through different streams 5 minutes ago? What was the flow for the last 7 days? What were the historic maximums for certain rivers? What is the level of lakes? What is the water quality like? Find the answers to these and other questions via this database. Learn more… |
 |
Alaska Volcano Observatory
| What is it? | What Can I Do With It? | What Does It Look Like? |
|---|---|---|
The Observatory was formed in 1988 and uses Federal, State, and university resources to monitor and study Alaska's hazardous volcanoes, to predict and record eruptive activity, and to mitigate volcanic hazards to life and property. It is a joint program of the USGS , the Geophysical Institute of the University of Alaska–Fairbanks, and the State of Alaska Division of Geological and Geophysical Surveys. |
Learn about and monitor volcanoes in Alaska—their current activity and historical eruptions, and how they affect climate, air quality, and more. Learn more… |
 |
Volcanoes of the Wrangell Mountains and Cook Inlet Region, Alaska—Selected Photographs
| What is it? | What Can I Do With It? | What Does It Look Like? |
|---|---|---|
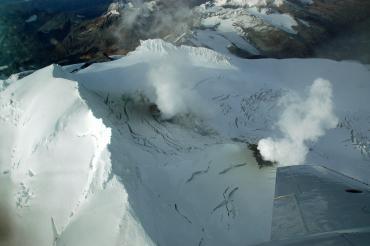
Alaska is home to more than 40 active volcanoes, many of which have erupted violently and repeatedly in the last 200 years. This CD contains 97 digitized color 35–mm images which represent a small fraction of thousands of photographs taken by Alaska Volcano Observatory scientists, other researchers, and private citizens. |
Examine photographs that portray volcanoes, document recent eruptive activity, and illustrate the range of volcanic phenomena observed in the Wrangell Mountains and Cook Inlet Region of Alaska. Learn more… |
 |
Volcanoes of the Alaska Peninsula and Aleutian Islands—Selected Photographs
| What is it? | What Can I Do With It? | What Does It Look Like? |
|---|---|---|
This CD–ROM contains 97 digitized, color 35–mm images that represent a small fraction of thousands of photographs taken by Alaska Volcano Observatory scientists, other researchers, and private citizens. |
Examine photographs that portray volcanoes, document recent eruptive activity, and illustrate the range of volcanic phenomena observed in the Alaska Peninsula and Aleutian Islands. Learn more… |
 |
Alaska Geospatial Data Clearinghouse
| What is it? | What Can I Do With It? | What Does It Look Like? |
|---|---|---|
The AGDC coordinates geospatial data activities and promotes data sharing among its Federal, State, Native, local, commercial, and non–governmental (NGO) member agencies for numerous purposes that require combinations of data on the same map. It was organized in the early 1990s to support the initiatives and goals of the Federal Geographic Data Committee (FGDC) in Alaska. |
Access an extensive list of Alaskan geospatial datasets that cover minerals, wildfire, parks, water resources, land cover, geology, wetlands, soils, population, and communities. Learn more… |
 |
Geomac Near Real-Time Wildfire Mapper
| What is it? | What Can I Do With It? | What Does It Look Like? |
|---|---|---|
Geospatial Multi–Agency Coordination is the result of collaboration by numerous Federal agencies for managing and understanding wildfires across the United States. |
Make maps of current and historical wildfires in Alaska, and examine the database behind each fire. Learn more… |
 |
Organic Geochemistry Data of Alaska
| What is it? | What Can I Do With It? | What Does It Look Like? |
|---|---|---|
The USGS has developed an Alaskan Organic Geochemical Database to house data resulting from investigations of the origin and occurrence of fossil fuels. |
The entire database can be downloaded in Microsoft Access 97 format. Individual geochemistry tables are also available in standard ASCII text format. You can view the summary information links to get an overview of the data table contents before downloading. Arc (ESRI) export files and ArcView shapefiles are provided to GIS users. Learn more… |
 |
Antarctica
Antarctica Maps List
| What is it? | What Can I Do With It? | What Does It Look Like? |
|---|---|---|
The USGS has published over 150 topographic and satellite image maps of Antarctica. |
Discover USGS maps of the Antarctic continent and selected regions on the continent with this online listing. Learn more… |
 |
Antarctica Satellite Image Map (Map I-2284)
| What is it? | What Can I Do With It? | What Does It Look Like? |
|---|---|---|
This map, a mosaic of satellite images, was created from imagery from the Advanced Very High Resolution Radiometer. |
Use this map of the entire Antarctica continent to learn and teach about the physical geography of the continent. Learn more… |
 |
Satellite Image Map of Antarctica (Map I-2560)
| What is it? | What Can I Do With It? | What Does It Look Like? |
|---|---|---|
This map, a mosaic of satellite images, contains few labels and therefore is useful for examining the surface of Antarctica. |
Use this map of the entire Antarctica continent to learn and teach about the physical geography of the continent. Learn more… |
 |
Aerial Photography of Antarctica
| What is it? | What Can I Do With It? | What Does It Look Like? |
|---|---|---|
The U.S. Antarctic Research Center holds approximately 400,000 aerial photographic prints from 1947 to the present. The photography was flown in support of NSF funded mapping and research by the USGS . |
Explore Antarctica via these images, which are spatially indexed and viewable online, or visit the USARC at the USGS National Center in Reston, Va. Learn more… |
 |
Antarctic Seismic Data Library
| What is it? | What Can I Do With It? | What Does It Look Like? |
|---|---|---|
The library provides open access worldwide to multi–channel, seismic–reflection data collected by many countries to study the structure of the Earth's crust at Antarctica. |
Investigate Antarctica´s seismicity with this data library. Learn more… |
 |
Astrogeology Ice and Polar Research
| What is it? | What Can I Do With It? | What Does It Look Like? |
|---|---|---|
The mission of the USGS Astrogeology Research Program is to establish and maintain geoscientific and technical expertise in planetary science and remote sensing to scientifically study and map extraterrestrial bodies, plan and conduct planetary exploration missions, and explore and develop new technologies in data processing, analysis, archiving, and distribution. |
Learn about the use of the world's glaciers to monitor climate change, read research papers from workshops on planetary ices and on volcano ice, and investigate results of searching for ice on Mars. Learn more… |
 |
Atlas of Antarctic Research
| What is it? | What Can I Do With It? | What Does It Look Like? |
|---|---|---|
This atlas is designed to promote greater geographic awareness of Antarctica and the digital geospatial data that describe it and to provide a common base for displaying research results, data collected, and descriptions of ongoing and past projects. The National Science Foundation provides funding, logistical support, and program oversight to this project. |
Use this online mapping site to examine elevation, geographic names, hydrography, locations of interest, ortho–imagery, and physical geography. Learn more… |
 |
Coastal-Change and Glaciological Maps of Antarctica
| What is it? | What Can I Do With It? | What Does It Look Like? |
|---|---|---|
This fact sheet outlines USGS efforts to map coastal change and glaciology in Antarctica and includes an index map showing the locations and names of the 23 published and planned 1:1,000,000–scale coastal–change and glaciological maps of the continent. |
Use this fact sheet to learn about the role coastal change and glaciology play in global climate change research and what the USGS is doing in these areas. Learn more… |
 |
Coastal-Change and Glaciological Map of the Bakutis Coast Area, Antarctica: 1972–2002
| What is it? | What Can I Do With It? | What Does It Look Like? |
|---|---|---|
This map, made up of satellite imagery, shows the coastal and glacial status and changes in the Bakutis area of Antarctica. |
Use this map to examine changes in the area and volume of polar ice sheets, which are linked to changes in global climate. Learn more… |
 |
Glaciological Map of the Eights Coast Area, Antarctica: 1972–2001
(Map I-2600-E)
| What is it? | What Can I Do With It? | What Does It Look Like? |
|---|---|---|
This map, made up of satellite imagery, shows the coastal and glacial status and changes in the Eights Coast area of Antarctica. |
Use this map to examine changes in the area and volume of polar ice sheets, which are linked to changes in global climate. Learn more… |
 |
Coastal-Change and Glaciological Map of the Saunders Coast Area, Antarctica: 1972–1997 (Map I-2600-G)
| What is it? | What Can I Do With It? |
|---|---|
This map, made up of satellite imagery, is of glaciers in the Saunders Coast area of Antarctica. |
Use this map to examine the status and changes in the Saunders Coast of Antarctica. Learn more… |
Earthshots Satellite Images of Global Change: Antarctica
| What is it? | What Can I Do With It? | What Does It Look Like? |
|---|---|---|
These images show the seaward edge of the Filchner Ice Shelf, on the coast of Antarctica, facing the Atlantic. In the austral winter of 1986, the front edge of the Filchner Ice Shelf broke off into the sea, forming three large icebergs. This was a major, long–awaited calving. |
Use this site to examine changes that can be detected via Landsat satellite imagery, and read the explanatory text provided. Learn more… |
 |
Satellite Image Atlas of Glaciers of the World—Antarctica
(USGS Professional Paper 1386-B)
| What is it? | What Can I Do With It? | What Does It Look Like? |
|---|---|---|
This paper offers detailed reports, images, graphs, and maps of Antarctica ´s glaciers, their movement and change, and implications for the planet.
|
Study glaciers of Antarctica, and associated regional and global natural and environmental implications, through this well–illustrated and visually stunning satellite image atlas. Learn more… |
 |
Scientific Committee on Antarctic Research
| What is it? | What Can I Do With It? | What Does It Look Like? |
|---|---|---|
The Scientific Committee on Antarctic Research (SCAR) is an interdisciplinary group of the International Council for Science, charged with coordinating and developing high–quality scientific research in Antarctica and on the role of the Antarctic region in the Earth system. |
Search the site to discover USGS contributions to the literature, research, and mission of SCAR. These contributions include seismic studies, mapping, geological studies to model Antarctic paleoenvironments, and much more. Learn more… |
 |
Scientific Committee on Antarctic Research Aerial Photography
| What is it? | What Can I Do With It? | What Does It Look Like? |
|---|---|---|
The Scientific Committee on Antarctic Research (SCAR) provides aerial photography and maps of Antarctica for scientists and others to determine geologic features, analyze ice stream flow, and monitor penguin and seal populations. Various mapping cameras and film types have been used to create over 300,000 frames of film since 1946, with annual acquisitions since 1980. |
Examine Antarctica using aerial photography. You can also visit the SCAR library at the USGS National Center in Reston, Va. Learn more… |
 |
U.S. Antarctic Resource Center
| What is it? | What Can I Do With It? | What Does It Look Like? |
|---|---|---|
The USARC is a joint effort of the USGS and the National Science Foundation´s United States Antarctic Program. It houses the Nation's most comprehensive collection of Antarctic maps, charts, satellite images, and photographs produced by the United States and other member nations of the Scientific Committee on Antarctic Research (SCAR). The USARC holdings include maps and charts from over 20 countries. |
Find aerial photographs, satellite images, maps, programs, and research. Learn more… |
 |
U.S. Antarctic Resource Center Flight Line Photo Indexes of Antarctica
| What is it? | What Can I Do With It? | What Does It Look Like? |
|---|---|---|
These are topographic reconnaissance maps with shaded relief at 1:250,000 scale. |
Use this site to examine topographic shaded–relief maps and aerial photographs of Antarctica. Learn more… |
 |
U.S. Antarctic Aerial Photograph Ground Control Sites
| What is it? | What Can I Do With It? | What Does It Look Like? |
|---|---|---|
These are aerial photographs and ground control data from the 1960s in Antarctica. |
Use this site to examine historical aerial photographs and compare them to newer maps and imagery to detect change. Learn more… |
 |
Climate Change
Permafrost Monitoring
| What is it? | What Can I Do With It? | What Does It Look Like? |
|---|---|---|
The U.S. Department of the Interior's DOI permafrost network in Alaska is part of a global network of permafrost monitoring stations that monitor for changes in the solid–earth component of the Earth's cryosphere. |
Use this Web resource to understand how permafrost is monitored and why it is important in polar research. Learn more… |
|
Climate Change Science
| What is it? | What Can I Do With It? | What Does It Look Like? |
|---|---|---|
USGS Global Change Research activities, including those focused on the Poles, strive to achieve a whole–system understanding of the interrelationships among earth surface processes, ecological systems, and human activities. Research activities are designed to allow anticipation of future environmental changes and impacts. |
Use this overview of USGS global change research activities as a great first steps in exploring how the USGS supports polar investigations. Learn more… |
 |
Earthshots Satellite Images of Global Change: Antarctica
| What is it? | What Can I Do With It? | What Does It Look Like? |
|---|---|---|
These images show the seaward edge of the Filchner Ice Shelf, on the coast of Antarctica, facing the Atlantic. In the austral winter of 1986, the front edge of the Filchner Ice Shelf broke off into the sea, forming three large icebergs. This was a major, long–awaited calving. |
Use this site to examine changes that can be detected via Landsat satellite imagery, and read the explanatory text provided. Learn more… |
|
Glaciers: Clues to Future Climate?
| What is it? | What Can I Do With It? | What Does It Look Like? |
|---|---|---|
This is an introductory booklet about glaciers and climate change. |
Understand how climate change is monitored and why it is important to the planet. Learn more… |
 |
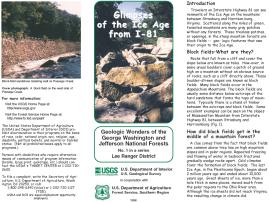
Glimpses of the Ice Age from Interstate 81
| What is it? | What Can I Do With It? | What Does It Look Like? |
|---|---|---|
This roadside geology guide explains how ice was important in the past landscape of Virginia. |
Use this guide to track the impact that ice and global climate have had on the people and landscape of Virginia. You can also use it as an example of how you might create your own local guidebook that illustrates these impacts in your area. Learn more… |
 |
The Great Ice Age
| What is it? | What Can I Do With It? | What Does It Look Like? |
|---|---|---|
This booklet discusses the Ice Age and its impact on the Earth´s surface. |
Use this booklet to get an overview of the Ice Age, the times when continental glaciers advanced, the impact that the Ice Age had on the history of the Earth, and why it is relevant today. Learn more… |
 |
Glaciers and Ice
Permafrost Monitoring
| What is it? | What Can I Do With It? | What Does It Look Like? |
|---|---|---|
The U.S. Department of the Interior's DOI permafrost network in Alaska is part of a global network of permafrost monitoring stations that monitor for changes in the solid–earth component of the Earth's cryosphere. |
Use this Web resource to understand how permafrost is monitored and why it is important in polar research. Learn more… |
|
Benchmark Glacier Studies
| What is it? | What Can I Do With It? | What Does It Look Like? |
|---|---|---|
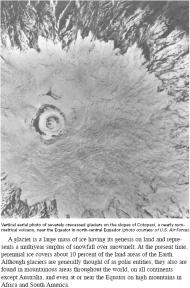
The USGS operates a long–term "benchmark" glacier program to monitor climate, glacier geometry, glacier mass balance, glacier motion, and stream runoff. The data collected are used to understand glacier–related hydrologic processes and improve the quantitative prediction of water resources, glacier–related hazards, and the consequences of climate change. |
Understand the significance of glaciers and the information they can provide to the scientific community. Learn more… |
 |
Coastal-Change and Glaciological Maps of Antarctica
| What is it? | What Can I Do With It? | What Does It Look Like? |
|---|---|---|
This fact sheet outlines USGS efforts to map coastal change and glaciology in Antarctica and includes an index map showing the locations and names of the 23 published and planned 1:1,000,000–scale coastal–change and glaciological maps of the continent. |
Use this fact sheet to learn about the role coastal change and glaciology play in global climate change research and what the USGS is doing in these areas. Learn more… |
|
Glacial Hazards Research
| What is it? | What Can I Do With It? | What Does It Look Like? |
|---|---|---|
The USGS conducts research on glacial hazards, such as avalanches, volcanoes, and more. |
Learn about glacial hazards and the contributions that the USGS makes to this field, including a glossary of glacier–related terms. Learn more… |
 |
Glacier Studies Project
| What is it? | What Can I Do With It? | What Does It Look Like? |
|---|---|---|
The Glacier Studies Project includes two active tasks: the Satellite Image Atlas of Glaciers of the World and the Coastal–Change and Glaciological Maps of Antarctica. Glaciers are one of the four sub–elements of the cryosphere [the other three are snow cover, floating ice (sea, lake, and river ice), and permafrost]. The cryosphere is particularly sensitive to changes in regional and global climate. |
See the status of the satellite image atlas of the world and the glaciological maps of Antarctica, with links to additional USGS publications on glaciations and other sites. Learn more… Also, view scans of selected 35mm slides on glaciers. Learn more… |
 |
Glaciers: Clues to Future Climate?
| What is it? | What Can I Do With It? | What Does It Look Like? |
|---|---|---|
This is an introductory booklet about glaciers and climate change. |
Understand how climate change is monitored and why it is important to the planet. Learn more… |
|
Global Ice Core Research
| What is it? | What Can I Do With It? | What Does It Look Like? |
|---|---|---|
The USGS studies ice cores recovered from glaciers to learn about Earth´s past environmental conditions. Every year, a layer of snow accumulates on glaciers and eventually turns to ice. Like reading the pages of a history book, analyzing the layers in a glacial ice core for specific chemical and physical components is a way of “reading” the environmental changes of the past. |
Use this resource to investigate data from ice cores collected from Greenland and Antarctica to get a better understanding of modern global environmental changes. Learn more… |
 |
The National Ice Core Laboratory
| What is it? | What Can I Do With It? | What Does It Look Like? |
|---|---|---|
The NICL holds 15,000 meters of ice cores from ice–covered regions of the world as an archive of the earth's climate history and of the composition of its atmosphere, including greenhouse gases. The NICL serves as a gathering place for U.S. and foreign climate and atmospheric researchers. |
Use the National Ice Core Laboratory site to investigate why ice cores are such an excellent recorder of Earth´s climatic history and what they tell about what the climate has done during the past half million years. Also, take a tour of the Laboratory if you are in Colorado. Learn more… |
 |
Monthly Average Polar Sea Ice Concentration
| What is it? | What Can I Do With It? | What Does It Look Like? |
|---|---|---|
This data set provides paleoclimate researchers with a tool for estimating the average seasonal variation in sea–ice concentration in the modern polar oceans and for estimating the modern monthly sea–ice concentration at any given polar oceanic location. |
Learn about the seasonal variation in sea ice with this extensive data set. Learn more… |
 |
Photography Project, Glacier National Park, Montana
| What is it? | What Can I Do With It? | What Does It Look Like? |
|---|---|---|
| This project describes methods of documenting landscape change. These striking images are created by pairing historic images with contemporary photos and have given global warming a face and made climate change a relevant issue. | Investigate glacial ice and vegetation changes at Glacier National Park during the past 100 years. The images are an effective visual means to help viewers understand that climate change contributes to the dynamic landscape changes so evident in Glacier National Park. Learn more… |
 |
Satellite Image Atlas of Glaciers of the World
(USGS Professional Paper 1386)
| What is it? | What Can I Do With It? | What Does It Look Like? |
|---|---|---|
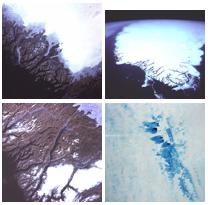
Between 1979 and 1981, satellite images were distributed to a team of 70 scientists from 25 nations and 45 institutions, who are authoring sections of this paper concerning either a geographic area (chapters B–K) or a glaciological topic (included in Chapter A—State of the Earth´s Cryosphere). Chapters thus far include Antarctica, Greenland, Europe, Turkey–Iran–Africa, Indonesia and New Zealand, South America, and North America. |
Study glaciers of the world, and associated population and natural and environmental implications through this series of well–illustrated and visually stunning satellite image atlases. Learn more… |
 |
Satellite Image Atlas of Glaciers of the World—Antarctica
(USGS Professional Paper 1386-B)
| What is it? | What Can I Do With It? | What Does It Look Like? |
|---|---|---|
This paper offers detailed reports, images, graphs, and maps of Antarctica ´s glaciers, their movement and change, and implications for the planet.
|
Study glaciers of Antarctica, and associated regional and global natural and environmental implications, through this well–illustrated and visually stunning satellite image atlas. Learn more… |
|
Strategy for Monitoring Glaciers
| What is it? | What Can I Do With It? | What Does It Look Like? |
|---|---|---|
This circular outlines glacier study methods—glaciers affect the volume, variability, and water quality of runoff. Assessing and predicting the effect of glaciers on water resources require a monitoring program to provide basic data to understand them. The monitoring program of the USGS employs a nested approach whereby an intensively studied glacier is surrounded by less intensively studied glaciers and those monitored solely by remote sensing. |
Use this report to learn about a method for monitoring glaciers, an important feature in understanding the hydrologic cycle, polar processes, and climate. Learn more… |
 |
The Great Ice Age
| What is it? | What Can I Do With It? | What Does It Look Like? |
|---|---|---|
This booklet discusses the Ice Age and its impact on the Earth´s surface. |
Use this booklet to get an overview of the Ice Age, the times when continental glaciers advanced, the impact that the Ice Age had on the history of the Earth, and why it is relevant today. Learn more… |
|
Velocities of Outlet Glaciers
| What is it? | What Can I Do With It? | What Does It Look Like? |
|---|---|---|
This report summarizes the results of velocity measurements of outlet glaciers, ice streams, and ice shelves around the Antarctic periphery. Changes in global climate and sea level are intricately linked to changes in the area and volume of polar ice sheets. Thus, melting of the ice sheets may severely impact the densely populated coastal regions on Earth. Melting of the West Antarctic ice sheet alone could raise sea level by approximately 5 meters. A critical parameter of ice sheets is their velocity field, which, together with ice thickness, allows the determination of discharge rates. |
Use this site to investigate the velocity of outlet glaciers to understand climate and sea level change. Learn more… |
 |
Astrogeology Ice and Polar Research
| What is it? | What Can I Do With It? | What Does It Look Like? |
|---|---|---|
The mission of the USGS Astrogeology Research Program is to establish and maintain geoscientific and technical expertise in planetary science and remote sensing to scientifically study and map extraterrestrial bodies, plan and conduct planetary exploration missions, and explore and develop new technologies in data processing, analysis, archiving, and distribution. |
Learn about the use of the world's glaciers to monitor climate change, read research papers from workshops on planetary ices and on volcano ice, and investigate results of searching for ice on Mars. Learn more… |
|
GLIMS — Global Land Ice Measurements from Space
| What is it? | What Can I Do With It? | What Does It Look Like? |
|---|---|---|
GLIMS is a project designed to monitor the world's glaciers primarily using data from the ASTER (Advanced Spaceborne Thermal Emission and reflection Radiometer) instrument aboard the EOS Terra spacecraft, launched in 1999. The USGS acquires an annual image of all the world's glaciers. GLIMS includes software for tracking glaciers' location, areal extent, and velocity; a network of global centers that monitor the glaciers in their regions. |
Use GLIMS to investigate the status of the Earth´s glaciers, including reports and presentations. This site includes an interactive GLIMS glacier map viewer, where you can download map data for use to analyze with geographic information systems software. Learn more… |
 |
Water Storage in Ice and Snow
| What is it? | What Can I Do With It? |
|---|---|
These facts and discussion focus on the volume and distribution of freshwater on the Earth and the role of ice in the water cycle. |
Use this informative set of tables, text, and images and related links to learn about the importance of polar ice on the Earth. Learn more… |
Proceedings from the Workshop on the Interaction of Volcanoes and Ice on the Earth and Mars
| What is it? | What Can I Do With It? | What Does It Look Like? |
|---|---|---|
This 62–page report covers the proceedings of a workshop held in Iceland in 2000 by scientists from the USGS and many other organizations. |
Investigate the processes and causes and effects of volcanoes and ice on the Earth and on Mars by reading the papers and following the links in this report. Learn more… |
 |
Time–Dependent Topography Through the Glacial Cycle
(IGBP PAGES/World Data Center-A for Paleoclimatology Data Contribution Series #93-015)
| What is it? | What Can I Do With It? | What Does It Look Like? |
|---|---|---|
This data set shows how the topography of continental ice cover changed during the last glacial cycle. The data come from a model because true measurements are not available for this prehistoric time. |
Use this data to examine topographical heights and ice–cover data at 1,000–year intervals since the last glacial maximum. Learn more… |
|
Photographs
Aerial Photography of Antarctica
| What is it? | What Can I Do With It? | What Does It Look Like? |
|---|---|---|
The U.S. Antarctic Research Center holds approximately 400,000 aerial photographic prints from 1947 to the present. The photography was flown in support of NSF funded mapping and research by the USGS . |
Explore Antarctica via these images, which are spatially indexed and viewable online, or visit the USARC at the USGS National Center in Reston, Va. Learn more… |
|
Photography Project, Glacier National Park, Montana
| What is it? | What Can I Do With It? | What Does It Look Like? |
|---|---|---|
| This project describes methods of documenting landscape change. These striking images are created by pairing historic images with contemporary photos and have given global warming a face and made climate change a relevant issue. | Investigate glacial ice and vegetation changes at Glacier National Park during the past 100 years. The images are an effective visual means to help viewers understand that climate change contributes to the dynamic landscape changes so evident in Glacier National Park. Learn more… |
|
U.S. Antarctic Resource Center Flight Line Photo Indexes of Antarctica
| What is it? | What Can I Do With It? | What Does It Look Like? |
|---|---|---|
These are topographic reconnaissance maps with shaded relief at 1:250,000 scale. |
Use this site to examine topographic shaded–relief maps and aerial photographs of Antarctica. Learn more… |
|
Volcanoes of the Alaska Peninsula and Aleutian Islands—Selected Photographs
| What is it? | What Can I Do With It? | What Does It Look Like? |
|---|---|---|
This CD–ROM contains 97 digitized, color 35–mm images that represent a small fraction of thousands of photographs taken by Alaska Volcano Observatory scientists, other researchers, and private citizens. |
Examine photographs that portray volcanoes, document recent eruptive activity, and illustrate the range of volcanic phenomena observed in the Alaska Peninsula and Aleutian Islands. Learn more… |
|
Volcanoes of the Wrangell Mountains and Cook Inlet Region, Alaska—Selected Photographs
| What is it? | What Can I Do With It? | What Does It Look Like? |
|---|---|---|
Alaska is home to more than 40 active volcanoes, many of which have erupted violently and repeatedly in the last 200 years. This CD contains 97 digitized color 35–mm images which represent a small fraction of thousands of photographs taken by Alaska Volcano Observatory scientists, other researchers, and private citizens. |
Examine photographs that portray volcanoes, document recent eruptive activity, and illustrate the range of volcanic phenomena observed in the Wrangell Mountains and Cook Inlet Region of Alaska. Learn more… |
|
Satellite Imagery
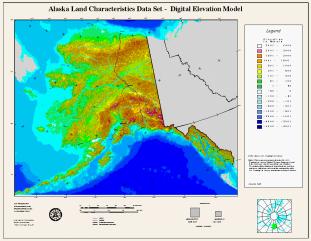
Antarctica DEM and AVHRR Stereo Images
| What is it? | What Can I Do With It? | What Does It Look Like? |
|---|---|---|
This is an online, digital elevation mapping of Antarctica. |
Investigate Antarctica using the stereo image, and examine landforms and structural features, such as surface fractures, faults, folds, and drainage patterns. Learn more… |
 |
Satellite Image Map of Antarctica (Map I-2560)
| What is it? | What Can I Do With It? | What Does It Look Like? |
|---|---|---|
This map, a mosaic of satellite images, contains few labels and therefore is useful for examining the surface of Antarctica. |
Use this map of the entire Antarctica continent to learn and teach about the physical geography of the continent. Learn more… |
|
Digital Elevation and Imagery Map of Antarctica
| What is it? | What Can I Do With It? | What Does It Look Like? |
|---|---|---|
This is a digital elevation map, in USGS MIPS image format. |
Use this mapping site to interactively examine elevation and satellite imagery of the Antarctic continent. Learn more… |
 |
Earthshots Satellite Images of Global Change: Antarctica
| What is it? | What Can I Do With It? | What Does It Look Like? |
|---|---|---|
These images show the seaward edge of the Filchner Ice Shelf, on the coast of Antarctica, facing the Atlantic. In the austral winter of 1986, the front edge of the Filchner Ice Shelf broke off into the sea, forming three large icebergs. This was a major, long–awaited calving. |
Use this site to examine changes that can be detected via Landsat satellite imagery, and read the explanatory text provided. Learn more… |
|
GLIMS — Global Land Ice Measurements from Space
| What is it? | What Can I Do With It? | What Does It Look Like? |
|---|---|---|
GLIMS is a project designed to monitor the world's glaciers primarily using data from the ASTER (Advanced Spaceborne Thermal Emission and reflection Radiometer) instrument aboard the EOS Terra spacecraft, launched in 1999. The USGS acquires an annual image of all the world's glaciers. GLIMS includes software for tracking glaciers' location, areal extent, and velocity; a network of global centers that monitor the glaciers in their regions. |
Use GLIMS to investigate the status of the Earth´s glaciers, including reports and presentations. This site includes an interactive GLIMS glacier map viewer, where you can download map data for use to analyze with geographic information systems software. Learn more… |
|
Landsat Satellite Imagery
| What is it? | What Can I Do With It? | What Does It Look Like? |
|---|---|---|
This is a continuous 30–year record of 30–meter resolution, multi–band satellite imagery for the planet, with some 15–meter data as well. The imagery is band separated and full resolution. |
Explore a variety of satellite imagery and learn more about the scope and history of the program at the Landsat site. Learn more… |
 |
Satellite Image Atlas of Glaciers of the World
(USGS Professional Paper 1386)
| What is it? | What Can I Do With It? | What Does It Look Like? |
|---|---|---|
Between 1979 and 1981, satellite images were distributed to a team of 70 scientists from 25 nations and 45 institutions, who are authoring sections of this paper concerning either a geographic area (chapters B–K) or a glaciological topic (included in Chapter A—State of the Earth´s Cryosphere). Chapters thus far include Antarctica, Greenland, Europe, Turkey–Iran–Africa, Indonesia and New Zealand, South America, and North America. |
Study glaciers of the world, and associated population and natural and environmental implications through this series of well–illustrated and visually stunning satellite image atlases. Learn more… |
|
Satellite Image Atlas of Glaciers of the World—Antarctica
(USGS Professional Paper 1386-B)
| What is it? | What Can I Do With It? | What Does It Look Like? |
|---|---|---|
This paper offers detailed reports, images, graphs, and maps of Antarctica ´s glaciers, their movement and change, and implications for the planet.
|
Study glaciers of Antarctica, and associated regional and global natural and environmental implications, through this well–illustrated and visually stunning satellite image atlas. Learn more… |
|
Wildlife
Marine Mammals
| What is it? | What Can I Do With It? | What Does It Look Like? |
|---|---|---|
The USGS is conducting studies to explain the movements and activities of polar bears. Polar bears and other marine mammals occur in the ice–covered portions of the Bering, Chukchi, and Beaufort Seas adjacent to Alaska. Polar bears´ dependence on drifting ice makes them an important indicator of global warming and its effects in the Arctic. |
Examine these studies to understand the movements and activities of polar bears, and investigate interactions between bears. Learn about their principal prey, ringed seals, and the sea ice that supports both of them. Study changes in movements and distribution patterns of polar bears and learn how understanding those patterns may help address habitat management issues. Learn more... |
 |
Alaska Wildlife
| What is it? | What Can I Do With It? | What Does It Look Like? |
|---|---|---|
Scientists at the Alaska Science Center study a wide range of arctic wildlife, including bears, caribou, moose, polar bears, sea otters, sheep, walrus, wolves, fish, and birds. |
See how scientists work in this extreme environment, collecting data and making observations about arctic wildlife. Find out the latest information the USGS is learning about arctic ecosystems and their response to global change. Learn more…. |
|
Arctic Refuge Coastal Plain Terrestrial Wildlife Research Summaries
(Biological Science Report USGS /BRD/BSR-2002-0001, 1988–1994)
| What is it? | What Can I Do With It? | What Does It Look Like? |
|---|---|---|
First established in 1960, the Arctic National Wildlife Refuge was expanded in 1980. This report is in response to that year´s legislation, which designated almost all of the original Arctic National Wildlife Range as wilderness and directed the Secretary of the Interior to conduct studies evaluating both the biological resources and the potential petroleum reserves of 1.5 million acres on the coastal plain of the Arctic Refuge (the “1002 Area”). |
Use this extensive and well–illustrated report to investigate population dynamics, distribution, energetics, and habitat use of key wildlife species. Also read discussions about potential effects and mitigation of petroleum development on wildlife and habitats. Learn more… |
|
Arctic National Wildlife Refuge (ANWR) Earth and Biological Science Data
| What is it? | What Can I Do With It? | What Does It Look Like? |
|---|---|---|
This is a library of a variety of base maps and statistical data on ANWR. |
Use this site for earth and biological investigations of the Arctic National Wildlife Refuge. Learn more… |
|
Other USGS Resources
ASK USGS
| What is it? | What Can I Do With It? | What Does It Look Like? |
|---|---|---|
| The USGS is more than scientific studies—it´s also people. USGS information specialists in our Natural Science Information Network USGS scientists can help you with your data needs. | Get personalized, expert service. Discover how to access and use USGS resources: people, maps, web sites, databases, photographs, satellite imagery, digital maps, books, reports, research, and more. Learn more… |
 |
Global GIS
| What is it? | What Can I Do With It? | What Does It Look Like? |
|---|---|---|
The USGS Global GIS database, created in partnership between the USGS and the American Geological Institute contains a wealth of USGS and other public domain data, including global map layers of elevation, land cover, seismicity, and resources of minerals and energy. |
Use the data, tools, and lessons to make maps and examine spatial patterns of land cover, elevation, geology, eco–regions, population, seismicity, energy, and minerals in an interactive way within an inquiry–based GIS environment. The GIS runs on the included ArcView Data Publisher software and is available on seven CD–ROMs or one DVD–ROM. Learn more… |
 |
National Atlas of the United States
| What is it? | What Can I Do With It? | What Does It Look Like? |
|---|---|---|
The National Atlas is a Web site where over 200 map layers from over a dozen different agencies. One of the premier sites for national map data. |
Make and print online maps, download layers to a geographic information system, and obtain statistics for a wealth of variables in Alaska and the rest of the United States. Topics include land use, invasive species, landforms, aquifers, watersheds, and more. Learn more… |
 |
Real-Time and Historical Earthquake Data
| What is it? | What Can I Do With It? | What Does It Look Like? |
|---|---|---|
This information details earthquakes from today to years in the past and is customizable for the polar regions and other parameters of time, depth, or magnitude. |
Use these sites to compare polar earthquakes to those elsewhere in the world: |
 |
The National Map
| What is it? | What Can I Do With It? | What Does It Look Like? |
|---|---|---|
The National Map is a wealth of dynamic map layers for the United States, including aerial photography, elevation, land use, energy assessments, hydrography, and much more. |
Use this resource to make and print hundreds of online maps and download spatial data to a geographic information system for Alaska and the rest of the United States. Learn more… |
 |
USGS Library
| What is it? | What Can I Do With It? | What Does It Look Like? |
|---|---|---|
| Established in 1879 to build and organize a collection of scientific materials in the earth sciences, the USGS Library is now the largest library for earth sciences in the world. The library holds over one million books and journals, 450,000 maps, 370,000 microforms, 270,000 pamphlets, 250,000 black–and–white photographs, 50,000 color transparencies, and 15,000 field–record notebooks, among other items. | Browse the USGS Library online or at a USGS facility, or obtain many USGS publications on interlibrary loan. Use the library to research thousands of USGS publications and studies concerning polar environments. Library holdings include USGS publications as well as those produced by State and foreign geological surveys, scientific societies, museums, academic institutions, and government scientific agencies. Learn more… |
 |
Geodetic Control
| What is it? | What Can I Do With It? | What Does It Look Like? |
|---|---|---|
This is a historical archive of geodetic surveys, maintained by the U.S. Antarctic Resource Center. These ground control locations and field records were needed to produce topographic maps, for planning, and for reconnaissance. |
Use this site to examine historical aerial photographs to understand the physical features of Antarctica. You can also compare the historical photographs to newer imagery to detect change over time. Learn more… |
 |
Geographic Names Information System
| What is it? | What Can I Do With It? | What Does It Look Like? |
|---|---|---|
The GNIS, developed by the USGS in cooperation with the U.S. Board on Geographic Names , contains information for all geographic features in Antarctica. The database contains the name of the feature and its latitude–longitude coordinates. |
Use the GNIS to look up names of features and places in Antarctica and locate them. Learn more… |  |
Mineral Resource Data System
| What is it? | What Can I Do With It? | What Does It Look Like? |
|---|---|---|
This system contains records of metallic and nonmetallic mineral resources of the world. Records contain descriptive information about mineral deposits and mineral commodities, including deposit name, location, commodity, deposit description, geologic characteristics, production, reserves, potential resources, and references. |
Use this database to examine minerals, geology, gravity, magnetism, and other characteristics of the polar regions. Learn more… |
 |
Mineral Resources Online Spatial Data
| What is it? | What Can I Do With It? | What Does It Look Like? |
|---|---|---|
This is a source for regional and global geology, geochemistry, geophysics, and mineral resource maps and data that includes a map browser for the United States and the world. |
Use this site´s interactive maps to explore mineral resources in the polar regions. Learn more… |
 |
Real-Time Water Data
| What is it? | What Can I Do With It? | What Does It Look Like? |
|---|---|---|
The network of thousands of USGS gaging stations in Alaska and elsewhere in the United States offers real–time and historic streamflow, water quality, groundwater, lake levels, and other hydrologic information in graph and tabular form. |
How much water flowed through different streams 5 minutes ago? What was the flow for the last 7 days? What were the historic maximums for certain rivers? What is the level of lakes? What is the water quality like? Find the answers to these and other questions via this database. Learn more… |
|
Shuttle Radar Topography Mission (SRTM) Elevation Data
| What is it? | What Can I Do With It? | What Does It Look Like? |
|---|---|---|
These are digital elevation data of the Earth´s surface, including the polar regions, at 90–meter spatial resolution, from which shaded relief, slope maps, contours, direction of slope, and more can be derived. |
Examine the elevation and topography of the polar regions with this global dataset. Learn more… |
 |
Global Change
| What is it? | What Can I Do With It? | What Does It Look Like? |
|---|---|---|
This teacher´s guide is focused on how the Earth is constantly changing. Weather and seasons are clear examples of regular changes in the global environment. Other changes are not as evident because they occur over intervals longer than a human lifetime or are not easily seen. Much of the change takes place on Earth is part of natural cycles. Human activity, however, can also cause environmental changes. |
Use activities on greenhouse gases, tree ring dating, and more to help teach concepts of global change. The Teacher's Guide explains how the activities are related to time, change, cycles, and Earth as home. Learn more… |
 |
