|
|
|
 |
| Assessment of Salinity and Irrigation/Drainage Practices |
 |
Mobile Four-Electrode Sensing System
| |
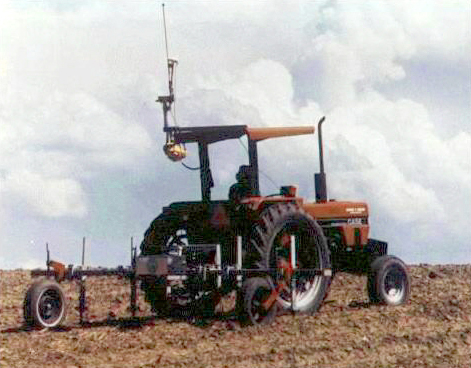 |
Figure 1. Mobile "fixed-array" four-electrode system
with GPS antenna mounted on top of the mast |
- The electrodes are combined into the "heels" of tillage shanks and mounted on a hydraulically controlled tool-bar attached to a tractor via a conventional three-point hitch
- The electrodes run at a depth of about 10 cm in the soil as the tractor moves across the field
- A Global Positioning System (GPS) antenna is positioned above the tractor cab and used to determine the spatial position of each sensor reading
- The ECa and the GPS signals are sensed at adjustable frequencies (as often as every second) and logged into memory for later analysis of salinity condition and spatial relations
- The four-electrode conductivity meter and the GPS receiver, their respective power supplies and their data loggers are contained in the water-tight, stainless steel box mounted behind the tool-bar shown in Figure 1.
- The tractor operator is provided with a remote monitor displaying time, ECa reading and logging status
- The analysis of the spatial data is carried out at the side of the field in a mobile office equipped with a computer work station and soil-salinity testing facilities
|
| |
Examples of output data obtained with the mobile four-electrode sensing system |
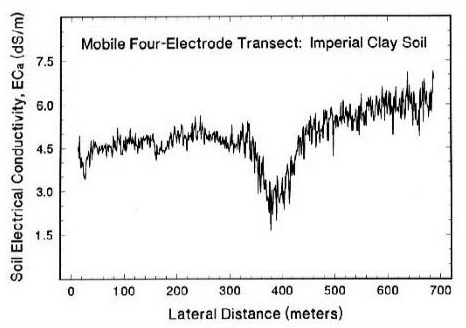 |
Figure 2. Relation between bulk soil electrical conductivity and distance along a transect
across a furrow-irrigated, tile-drained alfalfa field (Imperial clay soil)
located in the Imperial Valley of California |
- Figure 2 shows ECa readings collected every 1 m apart as the tractor moved across a furrow irrigated, tile-drained alfalfa field in the Imperial Valley of California
- The "minimum" in the ECa readings occurring at about 380 meters from the irrigation-intake end of the field corresponds to the position of a suite of subsurface drains
- Otherwise, the ECa values increased toward the "tail end" of the field, presumably due to reduced application and infiltration of irrigation water with distance "down" the furrows
|
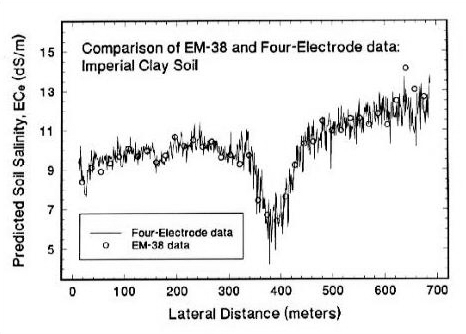 |
Figure 3. Average rootzone soil salinities on a laboratory, soil sample-extraction basis (ECe), as predicted from the measured ECa data along the transect |
- Figure 3 show correspondence between soil salinity predictions (ECe basis) based on soil electrical conductivity measurements obtained by mobile, electromagnetic induction (EMh) and four-electrode systcms along a transect across a furrow-irrigated, tile drained alfalfa field (Imperial clay soil) located in the Imperial Valley of California
- Also shown are salinities predicted from the EM-sensor system discussed later; the accuracy of these predictions is generally excellent
- These data suggest that much of the variability in average rootzone salinity across the field is caused by the interactive, effects of the drainage and irrigation systems
|
| |
Example of the marked effect that a subsurface drainage system can have on average rootzone salinity |
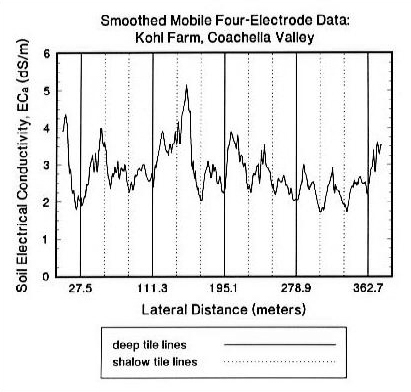 |
Figure 4. Relation between bulk soil electrical conductivity (ECa) and distance along a transect crossing two sets of tile-drains in a field (silty loam soil) located in the Coachella Valley of California |
- Figure 4 shows an example of a field of silty loam soil in the Coachella Valley which has two sets of buried "tile-lines"; one set being about 2.7 m deep and spaced about 90 m apart and another set being about 1.7 m deep and located at one-third and two-third distances between the deeper lines
- Soil salinity levels "mimicked" the drainage system, with high values of ECa measured in the soil located between tile-spacings and low values in the soil overlying them
- Concurrently, salinity tended to increase in the direction of irrigation (to the left in the figure), although the trend is "tempered" somewhat by the effect of the drainage system
|
| |
|
|
|
|
|
|
|
Last Modified: 04/07/2006
|
|