
|
|
|
|
|
|
|
|
|
|
|
|
|
EO-1 User's Guide
Data Properties : ALI
Spatial Characteristics
The ALI sensor provides a ground sample distance (GSD) of 10 meters for the visible panchromatic band (band 1) and a GSD of 30 meters for all other bands (bands 2-10). The spatial resolution of ALI is very similar to Landsat 7 ETM+ (30/15 meters), with the exception of the higher-resolution (10-meter) panchromatic band for ALI.
Since EO-1 was originally intended to be a technology demonstration mission, the ALI does not have a fully populated focal plane. Instead, the ALI has been partially populated with four sensor chip assemblies (SCAs) within the main focal plane assembly of the instrument (see Sensor Description).
The partially populated focal plane of ALI provides a cross-track ground swath width of 37 km, which is approximately one-fifth of the width of a standard Landsat scene. The along-track length of an ALI scene is variable, but will generally be 42 or 185 kilometers (depending on the original scene acquisition request). For more information on the geographic coverage area for ALI, see Orbit and Data Coverage.
ALI is a pushbroom instrument, which means that the spectral response from each unique detector will correspond to an individual column of pixels within the Level 1R product. For every multispectral band, each of the four SCAs contains 320 detectors (i.e. pixels) in the cross-track direction. For the panchromatic band, each SCA contains 960 detectors (or pixels) in the cross-track direction. There is an overlapping coverage of approximately 10 detectors (i.e. pixels) between each adjacent pair of SCAs for the multispectral bands, but the end result may vary from scene to scene due to local or scene-specific effects such as terrain, elevation, and/or look angle. For the panchromatic band, there is a coverage overlap of approximately 30 detectors (i.e. pixels) between each adjacent pair of SCAs. (See Figure 1.)

Figure 1. Schematic diagram showing the arrangement of ALI data from each of the four individual sensor chip arrays (SCAs) for the multispectral bands. Each SCA contains a total of 320 detectors, or pixels (960 for the panchromatic band). There will be an overlap region of approximately 10 detectors, or pixels (30 detectors/pixels for the panchromatic band) between each adjacent pair of SCAs. Note that the exact location of the detector overlap region may vary from one scene to the next (and also within an individual scene) due to the effects of terrain, pointing angle, and other factors.
Within the main focal plane assembly, SCA 1 and SCA 3 are offset relative to SCA 2 and SCA 4 (see Sensor Description). Due to this staggered arrangement, there will be a difference in the start and end of populated image data region contributed by SCA 1 and SCA 3 vs. SCA 2 and SCA 4 within the Level 1R product (see Figure 2). The amount of offset between neighboring SCAs will vary by band (due to detector arrangement), but users should be aware that it may be significant for some bands. The exact amount of offset will vary, but band 2 will generally have the smallest amount of SCA offset (187 pixels, or 5.6 km in Figure 2) whereas band 10 will have the largest offset (507 pixels, or 15.2 km in Figure 2) for band 10.

Figure 2. Comparison of the minimum and maximum along-track SCA offsets for individual bands within a sample Level 1R ALI scene. The image on the left shows band 2, which has the smallest amount of along-track offset (187 pixels, or 5.61 km). The image on the right shows band 10, which has the largest amount of along-track offset (507 pixels, or 15.2 km). SCA offsets for the panchromatic (band 1) and all other bands (3-9) will always fall between these two.
The detectors for individual bands are staggered within an SCA, and these detector offsets will determine the amount of image fill preamble for each band. In general, there will be a 20-pixel difference in the start and end line of populated image data for each consecutive band. Coincident imagery for all bands starts at line number 514. The actual start pixel locations for each band are provided in Table 1.
M1R M2R M3R M4R Band 1 (pan) 450/444 75/69 450/444 75/69
Band 2 352/350 165/163 352/350 165/163 Band 3 372/370 145/143 372/370 145/143 Band 4 392/390 125/123 392/390 125/123
Band 5 412/410 105/103 412/410 105/103
Band 6 432/430 85/83 432/430 85/83
Band 7 452/450 65/63 452/450 65/63
Band 8 474/468 47/41 474/468 47/41 Band 9 494/488 27/21 494/488 27/21 Band 10 514/508 7/1 514/508 7/1
Table 1. Pixel numbers (line/row) representing the onset of populated image data for each band. The first number represents the onset of populated image data from odd-numbered detectors (i.e. 1/3/5 etc.). The second number represents the onset of populated image data from even-numbered detectors (i.e. 2/4/6 etc.)
Spectral Characteristics
ALI provides discrete multispectral coverage over ten spectral bands from the visible and near-infrared (VNIR) and shortwave infrared (SWIR) ranges (Table 2). Please note the difference in band designation for the USGS EROS Data Center (EDC) ALI product, compared to previous ALI engineering documentation. A comparison of these band designations is also included in Table 2.
Since ALI was built to provide vital information for the next Landsat mission, most of the ALI bands will be very comparable to those of the Landsat 7 Enhanced Thematic Mapper Plus (ETM+). However, ALI includes an additional band in the visible blue range (band 2), as well as two additional bands in the SWIR (bands 7 and 8). Note that ALI does not include a thermal band. Table 3 shows a list of the ALI bands, with correlative Landsat 7 ETM+ bands.
The spectral response curves for ALI are shown in Figure 3. Spectral center wavelengths (CWL) for each of the ALI bands are also provided (Table 4). Table 5 shows a list of the particular Hyperion bands that would be correlative with the CWL for each of the ALI bands.
ALI band |
ALI band (alternate designation*) |
Spectral range (μm) |
Description |
|
|||
1 |
PAN |
0.48-0.69 |
panchromatic |
2 |
MS-1’ (or 1P) |
0.433-0.453 |
VNIR (blue) |
3 |
MS-1 |
0.45-0.515 |
VNIR (blue) |
4 |
MS-2 |
0.525-0.605 |
VNIR (green) |
5 |
MS-3 |
0.63-0.69 |
VNIR (red) |
6 |
MS-4 |
0.775-0.805 |
VNIR |
7 |
MS-4’ (or 4P) |
0.845-0.89 |
VNIR |
8 |
MS-5’ (or 5P) |
1.2-1.3 |
SWIR |
9 |
MS-5 |
1.55-1.75 |
SWIR |
10 |
MS-7 |
2.08-2.35 |
SWIR |
|
|
||
(not available) |
(not available) |
TIR |
|
|
|||
* Band designations in the left-hand column refer to the band files provided in the delivered ALI product. Band numbers in the right-hand column refer to previous ALI band numbers, with prime designators (' or P) referenced to Landsat 7 ETM+. |
|||
Table 2. Band designations for the ALI sensor.
ALI Band # |
ALI spectral range (μm) |
Landsat 7 Band # |
ETM+ spectral range (μm) |
Description |
|
Band 1 |
(PAN) |
.048-0.69 |
Band 8 |
.52-.90 |
panchromatic |
Band 2 |
(MS-1’) |
0.433-0.453 |
(not available) |
VNIR (blue) |
|
Band 3 |
(MS-1) |
0.45-0.515 |
Band 1 |
0.45-0.52 |
VNIR (blue) |
Band 4 |
(MS-2) |
0.525-0.605 |
Band 2 |
0.53-0.61 |
VNIR (green) |
Band 5 |
(MS-3) |
0.63-0.69 |
Band 3 |
0.63-0.69 |
VNIR (red) |
Band 6 |
(MS-4) |
0.775-0.805 |
Band 4 |
0.78-0.90 |
VNIR |
Band 7 |
(MS-4’) |
0.845-0.89 |
(not available) |
VNIR |
|
Band 8 |
(MS-5’) |
1.2-1.3 |
(not available) |
SWIR |
|
Band 9 |
(MS-5) |
1.55-1.75 |
Band 5 |
1.55-1.75 |
SWIR |
Band 10 |
(MS-7) |
2.08-2.35 |
Band 7 |
2.09-2.35 |
SWIR |
|
|
||||
(not available) |
Band 6 |
10.40-12.50 |
TIR |
||
Table 3. ALI bands with correlative bands for the Landsat 7 ETM+ sensor.
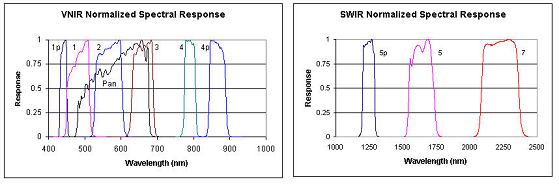
Table 4. Spectral center wavelengths (CWL) and bandwidths for the ALI sensor
.
ALI band no. |
CWL (nm) |
Hyperion band no. |
CWL (nm) |
Range |
2 |
441.6 |
10 |
447.17 |
VNIR 1 |
3 |
484.8 |
14 |
487.87 |
VNIR 1 |
4 |
567.2 |
22 |
569.27 |
VNIR 1 |
5 |
660 |
31 |
660.85 |
VNIR 1 |
6 |
790 |
44 |
793.13 |
VNIR 2 |
7 |
865.6 |
51 |
864.35 |
VNIR 2 |
8 |
1244.4 |
110 |
1245.36 |
SWIR 2 |
9 |
1640.1 |
149 |
1638.81 |
SWIR 3 |
10 |
2225.7 |
207 |
2224.03 |
SWIR 4 |
Table 5. Spectral center wavelengths (CWL) for the ALI multispectral bands, with correlative CWL and band number for the Hyperion sensor.
