 |
|
|||
State Energy Profile - WisconsinEnergy Information Administration - State Energy Profileshttp://tonto.eia.doe.gov/state |
||||||
|---|---|---|---|---|---|---|
|
||||||
|
Last Update: January 02, 2009
Next Update: January 08 , 2009 |
||||||
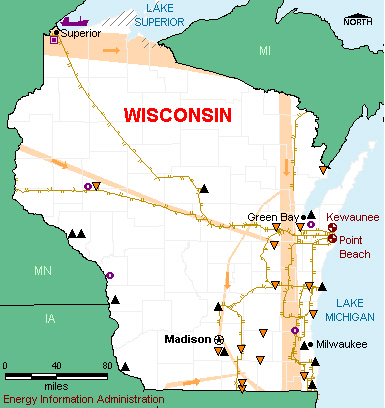
OverviewResources and ConsumptionWisconsin has some renewable energy resources but lacks more conventional fossil fuel resources. Several rivers that cross the State provide hydroelectric power potential, and the State's high corn production positions it to be one of the Nation's leading producers of ethanol. Wisconsin’s population and energy consumption are about average among U.S. States. The industrial sector leads total State energy consumption. Energy-intensive industries in Wisconsin include forest products and metal casting. PetroleumWisconsin has one small refinery on Lake Superior. It receives crude oil supply from the Lakehead Pipeline System, which originates in western Canada and delivers crude to eastern Ontario and throughout the Great Lakes region. Refineries in the metropolitan areas of Chicago and Minneapolis provide petroleum products for most of Wisconsin's market. The southeastern corner of Wisconsin requires the use of reformulated motor gasoline blended with ethanol. Wisconsin produces a substantial amount of ethanol at several ethanol plants in the southern and central portions of the State. Natural GasNatural gas markets in Wisconsin receive supplies primarily from the United States via the ANR Pipeline and the Guardian Pipeline, which run through a major hub in Joliet, Illinois. Natural gas is also delivered to Wisconsin from U.S. and Canadian sources by three other pipelines operated by the Northern Natural Gas Co., the Natural Gas Pipeline Co., and the Viking Gas Transmission Co. Wisconsin's residential and industrial sectors lead the State's natural gas consumption. Natural gas dominates the home heating market, as roughly two-thirds of Wisconsin households use natural gas as their primary fuel for home heating. Coal, Electricity, and RenewablesCoal typically fuels more than two-thirds of Wisconsin's electricity generation. Nuclear reactors and natural gas-fired plants supply most of the remaining generation, and electricity transfers from other States satisfy the rest of demand. About four-fifths of the coal used in Wisconsin arrives by railcar from Wyoming. Two nuclear power plants, located on Lake Michigan, supply about one-fifth of Wisconsin’s electricity generation. The Unit 1 reactor at the Point Beach nuclear plant is one of the oldest operating reactors in the United States. Small hydroelectric facilities also contribute electricity to the grid, although wood is the State's most-used renewable energy resource. Wisconsin's Governor recently announced a goal of generating one-fourth of the State's electricity and one-fourth of its transportation fuel from renewable sources by 2025. Per capita electricity use in Wisconsin is somewhat less than the national average, due in part to heavy reliance on natural gas for home heating. Just over one-tenth of Wisconsin households rely on electricity as their primary energy source for home heating. |
|
| Economy | ||||
| Population and Employment | Wisconsin | U.S. Rank | Period | |||||||
| Population | 5.6 million | 20 |
2007 | |||||||
| Civilian Labor Force | 3.1 million | 16 |
2007 | |||||||
| Per Capita Personal Income | $36,047 | 26 |
2007 | |||||||
| Industry | Wisconsin | U.S. Rank | Period | |||||||
| Gross Domestic Product by State | $232.3 billion | 21 | 2007 | |||||||
| Land in Farms | 15.7 million acres | 18 |
2002 | |||||||
| Market Value of Agricultural Products Sold | $5.6 billion | 10 |
2002 | |||||||
| Prices | ||||
| Petroleum | Wisconsin | U.S. Avg. | Period | |||||||
| Domestic Crude Oil First Purchase | — | $98.5/barrel | Sep-08 | |||||||
| No. 2 Heating Oil, Residential | $3.596/gal | $3.666/gal | Sep-08 | |||||||
| Regular Motor Gasoline Sold Through Retail Outlets (Excluding Taxes) | $3.25/gal | $3.207/gal | Sep-08 | |||||||
| State Tax Rate on Motor Gasoline (other taxes may apply) |
$0.329/gal | $0.2159/gal | Aug-08 | |||||||
| No. 2 Diesel Fuel Sold Through Retail Outlets (Excluding Taxes) | $3.445/gal | $3.484/gal | Sep-08 | |||||||
| State Tax Rate on On-Highway Diesel (other taxes may apply) |
$0.329/gal | $0.2214/gal | Aug-08 | |||||||
| Natural Gas | Wisconsin | U.S. Avg. | Period | |||||||
| Wellhead | — | $6.40/thousand cu ft | 2006 | |||||||
| City Gate | $9.19/thousand cu ft | $8.96/thousand cu ft | Sep-08 | |||||||
| Residential | $16.69/thousand cu ft | $17.94/thousand cu ft | Sep-08 | |||||||
| Coal | Wisconsin | U.S. Avg. | Period | |||||||
| Average Open Market Sales Price | — | $26.20/short ton | 2007 | |||||||
| Delivered to Electric Power Sector | $ 2.14/million Btu | $ 2.16 /million Btu | Sep-08 | |||||||
| Electricity | Wisconsin | U.S. Avg. | Period | |||||||
| Residential | 11.78 cents/kWh | 11.94 cents/kWh | Sep-08 | |||||||
| Commercial | 9.58 cents/kWh | 10.77 cents/kWh | Sep-08 | |||||||
| Industrial | 6.84 cents/kWh | 7.36 cents/kWh | Sep-08 | |||||||
|
|||||||||||||||||||||||||
| Reserves | Wisconsin | Share of U.S. | Period | ||||||||||||||||||||||
| Crude Oil | — | — | 2007 | ||||||||||||||||||||||
| Dry Natural Gas | — | — | 2007 | ||||||||||||||||||||||
| Natural Gas Liquids | — | — | 2007 | ||||||||||||||||||||||
| Recoverable Coal at Producing Mines | — | — | 2007 | ||||||||||||||||||||||
| Rotary Rigs & Wells | Wisconsin | Share of U.S. | Period | ||||||||||||||||||||||
| Rotary Rigs in Operation | 0 | 0.0% | 2007 | ||||||||||||||||||||||
| Crude Oil Producing Wells | 0 | 0.0% | 2007 | ||||||||||||||||||||||
| Natural Gas Producing Wells | — | — | 2006 | ||||||||||||||||||||||
| Production | Wisconsin | Share of U.S. | Period | ||||||||||||||||||||||
| Total Energy | 211 trillion Btu | 0.3% | 2005 | ||||||||||||||||||||||
| Crude Oil | — | — | Jul-08 | ||||||||||||||||||||||
| Natural Gas - Marketed | — | — | 2006 | ||||||||||||||||||||||
| Coal | — | — | 2007 | ||||||||||||||||||||||
| Capacity | Wisconsin | Share of U.S. | Period | ||||||||||||||||||||||
| Crude Oil Refinery Capacity (as of Jan. 1) | 34,300 barrels/calendar day | 0.2% | 2008 | ||||||||||||||||||||||
| Electric Power Industry Net Summer Capability | 16,415 MW | 1.7% | 2006 | ||||||||||||||||||||||
| Net Electricity Generation | Wisconsin | Share of U.S. | Period | ||||||||||||||||||||||
| Total Net Electricity Generation | 5,153 thousand MWh | 1.5% | Sep-08 | ||||||||||||||||||||||
| Petroleum-Fired | 5 thousand MWh | 0.2% | Sep-08 | ||||||||||||||||||||||
| Natural Gas-Fired | 348 thousand MWh | 0.4% | Sep-08 | ||||||||||||||||||||||
| Coal-Fired | 3,384 thousand MWh | 2.1% | Sep-08 | ||||||||||||||||||||||
| Nuclear | 1,137 thousand MWh | 1.7% | Sep-08 | ||||||||||||||||||||||
| Hydroelectric | 108 thousand MWh | 0.7% | Sep-08 | ||||||||||||||||||||||
| Other Renewables | 105 thousand MWh | 1.3% | Sep-08 | ||||||||||||||||||||||
| Stocks | Wisconsin | Share of U.S. | Period | ||||||||||||||||||||||
| Motor Gasoline (Excludes Pipelines) | 763 thousand barrels | 1.3% | Sep-08 | ||||||||||||||||||||||
| Distillate Fuel Oil (Excludes Pipelines) | 1,340 thousand barrels | 1.4% | Sep-08 | ||||||||||||||||||||||
| Natural Gas in Underground Storage | — | — | Sep-08 | ||||||||||||||||||||||
| Petroleum Stocks at Electric Power Producers | 347 thousand barrels | 0.9 % | Sep-08 | ||||||||||||||||||||||
| Coal Stocks at Electric Power Producers | 4,469 thousand tons | 3.1% | Sep-08 | ||||||||||||||||||||||
| Production Facilities | Wisconsin | ||||||||||||||||||||||||
| Major Coal Mines | None | ||||||||||||||||||||||||
| Petroleum Refineries | Murphy Oil USA Inc (Superior) | ||||||||||||||||||||||||
| Major Non-Nuclear Electricity Generating Plants | Pleasant Prairie (Wisconsin Electric Power Co) • South Oak Creek (Wisconsin Electric Power Co) • Columbia (Wisconsin Power & Light Co) • Edgewater (Wisconsin Power & Light Co) • Fox Energy Center (GE Energy Services) | ||||||||||||||||||||||||
| Nuclear Power Plants | Point Beach (Wisconsin Electric Power Co) • Kewaunee (Dominion Energy Kewaunee Inc.) | ||||||||||||||||||||||||
| Distribution & Marketing | ||||
| Distribution Centers | Wisconsin | |||||||||
| Oil Seaports/Oil Import Sites | Superior | |||||||||
| Natural Gas Market Centers | None | |||||||||
| Major Pipelines | Wisconsin | |||||||||
| Crude Oil | Lakehead | |||||||||
| Petroleum Product | Koch • West Shore • Williams. | |||||||||
| Liquefied Petroleum Gases | Koch • Lakehead • MAPCO. | |||||||||
| Interstate Natural Gas Pipelines | ANR Pipeline Co. • Great Lakes Gas Transmission Ltd. • Northern Natural Gas Co. • Viking Gas Transmission Co. | |||||||||
| Fueling Stations | Wisconsin | Share of U.S. | Period | |||||||
| Motor Gasoline | 3,919 | 2.4% | 2007 | |||||||
| Liquefied Petroleum Gases | 45 | 2.0% | 2007 | |||||||
| Compressed Natural Gas | 19 | 2.4% | 2007 | |||||||
| Ethanol | 93 | 6.6% | 2007 | |||||||
| Other Alternative Fuels | 3 | 0.3% | 2007 | |||||||
| Consumption | ||||
| per Capita | Wisconsin | U.S. Rank | Period | |||||||
| Total Energy | 326 million Btu | 29 | 2006 | |||||||
| by Source | Wisconsin | Share of U.S. | Period | |||||||
| Total Energy | 1,818 trillion Btu | 1.8% | 2006 | |||||||
| Total Petroleum | 115,727 thousand barrels | 1.5% | 2006 | |||||||
| Motor Gasoline | 60,526 thousand barrels | 1.8% | 2006 | |||||||
| Distillate Fuel | 28,387 thousand barrels | 1.9% | 2006 | |||||||
| Liquefied Petroleum Gases | 10,155 thousand barrels | 1.4% | 2006 | |||||||
| Jet Fuel | 2,748 thousand barrels | 0.5% | 2006 | |||||||
| Natural Gas | 372,457 million cu ft | 1.6% | 2006 | |||||||
| Coal | 25,488 thousand short tons | 2.3% | 2006 | |||||||
| by End-Use Sector | Wisconsin | Share of U.S. | Period | |||||||
| Residential | 400,050 billion Btu | 1.9% | 2006 | |||||||
| Commercial | 344,812 billion Btu | 1.9% | 2006 | |||||||
| Industrial | 632,377 billion Btu | 2.0% | 2006 | |||||||
| Transportation | 441,236 billion Btu | 1.5% | 2006 | |||||||
| for Electricity Generation | Wisconsin | Share of U.S. | Period | |||||||
| Petroleum | 10 thousand barrels | 0.2% | Sep-08 | |||||||
| Natural Gas | 2,828 million cu ft | 0.5% | Sep-08 | |||||||
| Coal | 2,053 thousand short tons | 2.4% | Sep-08 | |||||||
| for Home Heating (share of households) | Wisconsin | U.S. Avg. | Period | |||||||
| Natural Gas | 66% | 51.2% | 2000 | |||||||
| Fuel Oil | 8% | 9.0% | 2000 | |||||||
| Electricity | 11% | 30.3% | 2000 | |||||||
| Liquefied Petroleum Gases | 11% | 6.5% | 2000 | |||||||
| Other/None | 4% | 1.8% | 2000 | |||||||
| Environment | ||||
| Special Programs | Wisconsin | |||||||||
| Clean Cities Coalitions | Wisconsin-Southeast Area | |||||||||
| Alternative Fuels | Wisconsin | Share of U.S. | Period | |||||||
| Alternative-Fueled Vehicles in Use | 8,178 | 1.4% | 2006 | |||||||
| Ethanol Plants | 6 | 4.2% | 2008 | |||||||
| Ethanol Plant Capacity | 230 million gal/year | 2.9% | 2008 | |||||||
| Ethanol Use in Gasohol | 108,564 thousand gal | 3.0% | 2004 | |||||||
| Electric Power Industry Emissions | Wisconsin | Share of U.S. | Period | |||||||
| Carbon Dioxide |
48,250,876 metric tons | 2.0% | 2006 | |||||||
| Sulfur Dioxide |
208,119 metric tons | 2.2% | 2006 | |||||||
| Nitrogen Oxide |
76,979 metric tons | 2.0% | 2006 | |||||||
| — = No data reported; NA = Not available; W = Withheld to avoid disclosure of individual company data. |
|
||||||||||||||||||||||||||||||||||||||||||||||||||||||||||||||||||||||||||||||||||||||||||||||||||||||||||||||||||||||||||||||||||||||||||||||||||||||||||||||