 |
|
|||
State Energy Profile - South CarolinaEnergy Information Administration - State Energy Profileshttp://tonto.eia.doe.gov/state |
||||||
|---|---|---|---|---|---|---|
|
||||||
|
Last Update: January 02, 2009
Next Update: January 08 , 2009 |
||||||
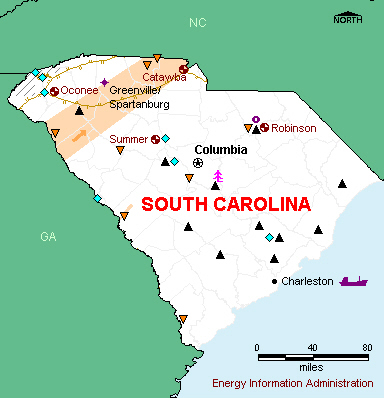
OverviewResources and ConsumptionSouth Carolina’s only substantial energy resource is its system of rivers and lakes, which offers potential for hydroelectric power generation. Driven in part by the energy-intensive chemical manufacturing industry, South Carolina’s industrial sector accounts for approximately two-fifths of State energy consumption. PetroleumSouth Carolina receives petroleum products shipments at the Port of Charleston and via the Colonial and Plantation pipelines from the Gulf Coast. The Dixie Pipeline, also originating in the Gulf Coast, supplies the State’s propane demand. South Carolina's total petroleum consumption is near the national median,, and South Carolina is one of the few States that allow the statewide use of conventional motor gasoline. (Most States require the use of specific gasoline blends in non-attainment areas due to air-quality considerations.) Natural GasSouth Carolina’s natural gas supply is transported from the Gulf Coast by two major interstate pipeline systems. Although more than one-fourth of households in South Carolina use natural gas as their main energy source for home heating, winters are generally mild and overall demand is relatively low. Coal, Electricity, and RenewablesNuclear power accounts for more than one-half of South Carolina’s electricity generation. With four active nuclear power plants, South Carolina is among the top nuclear power producers in United States. Coal fuels about two-fifths of net electricity generation. South Carolina has no coal mines, and coal-fired power plants rely on supplies shipped from Kentucky, and, to a lesser extent, West Virginia and Tennessee. South Carolina produces hydroelectric power from facilities located in several river and lake basins. Per capita electricity consumption in South Carolina is among the highest in the United States. The State’s high per capita electricity consumption is due to high industrial use, high demand for electric air-conditioning during hot summer months, and the widespread use of electricity for home heating during typically mild winter months. Nearly three-fifths of South Carolina households use electricity as their primary energy source for home heating. |
|
| Economy | ||||
| Population and Employment | South Carolina | U.S. Rank | Period | |||||||
| Population | 4.4 million | 25 |
2007 | |||||||
| Civilian Labor Force | 2.2 million | 24 |
2007 | |||||||
| Per Capita Personal Income | $31,013 | 48 |
2007 | |||||||
| Industry | South Carolina | U.S. Rank | Period | |||||||
| Gross Domestic Product by State | $152.8 billion | 28 | 2007 | |||||||
| Land in Farms | 4.8 million acres | 38 |
2002 | |||||||
| Market Value of Agricultural Products Sold | $1.5 billion | 35 |
2002 | |||||||
| Prices | ||||
| Petroleum | South Carolina | U.S. Avg. | Period | |||||||
| Domestic Crude Oil First Purchase | — | $98.5/barrel | Sep-08 | |||||||
| No. 2 Heating Oil, Residential | — | $3.666/gal | Sep-08 | |||||||
| Regular Motor Gasoline Sold Through Retail Outlets (Excluding Taxes) | $3.352/gal | $3.207/gal | Sep-08 | |||||||
| State Tax Rate on Motor Gasoline (other taxes may apply) |
$0.16/gal | $0.2159/gal | Aug-08 | |||||||
| No. 2 Diesel Fuel Sold Through Retail Outlets (Excluding Taxes) | — | $3.484/gal | Sep-08 | |||||||
| State Tax Rate on On-Highway Diesel (other taxes may apply) |
$0.16/gal | $0.2214/gal | Aug-08 | |||||||
| Natural Gas | South Carolina | U.S. Avg. | Period | |||||||
| Wellhead | — | $6.40/thousand cu ft | 2006 | |||||||
| City Gate | $10.48/thousand cu ft | $8.96/thousand cu ft | Sep-08 | |||||||
| Residential | $27.72/thousand cu ft | $17.94/thousand cu ft | Sep-08 | |||||||
| Coal | South Carolina | U.S. Avg. | Period | |||||||
| Average Open Market Sales Price | — | $26.20/short ton | 2007 | |||||||
| Delivered to Electric Power Sector | $ 3.14/million Btu | $ 2.16 /million Btu | Sep-08 | |||||||
| Electricity | South Carolina | U.S. Avg. | Period | |||||||
| Residential | 10.36 cents/kWh | 11.94 cents/kWh | Sep-08 | |||||||
| Commercial | 8.83 cents/kWh | 10.77 cents/kWh | Sep-08 | |||||||
| Industrial | 5.70 cents/kWh | 7.36 cents/kWh | Sep-08 | |||||||
|
|||||||||||||||||||||||||
| Reserves | South Carolina | Share of U.S. | Period | ||||||||||||||||||||||
| Crude Oil | — | — | 2007 | ||||||||||||||||||||||
| Dry Natural Gas | — | — | 2007 | ||||||||||||||||||||||
| Natural Gas Liquids | — | — | 2007 | ||||||||||||||||||||||
| Recoverable Coal at Producing Mines | — | — | 2007 | ||||||||||||||||||||||
| Rotary Rigs & Wells | South Carolina | Share of U.S. | Period | ||||||||||||||||||||||
| Rotary Rigs in Operation | 0 | 0.0% | 2007 | ||||||||||||||||||||||
| Crude Oil Producing Wells | 0 | 0.0% | 2007 | ||||||||||||||||||||||
| Natural Gas Producing Wells | — | — | 2006 | ||||||||||||||||||||||
| Production | South Carolina | Share of U.S. | Period | ||||||||||||||||||||||
| Total Energy | 661 trillion Btu | 1.0% | 2005 | ||||||||||||||||||||||
| Crude Oil | — | — | Jul-08 | ||||||||||||||||||||||
| Natural Gas - Marketed | — | — | 2006 | ||||||||||||||||||||||
| Coal | — | — | 2007 | ||||||||||||||||||||||
| Capacity | South Carolina | Share of U.S. | Period | ||||||||||||||||||||||
| Crude Oil Refinery Capacity (as of Jan. 1) | — | — | 2008 | ||||||||||||||||||||||
| Electric Power Industry Net Summer Capability | 22,782 MW | 2.3% | 2006 | ||||||||||||||||||||||
| Net Electricity Generation | South Carolina | Share of U.S. | Period | ||||||||||||||||||||||
| Total Net Electricity Generation | 8,468 thousand MWh | 2.5% | Sep-08 | ||||||||||||||||||||||
| Petroleum-Fired | 9 thousand MWh | 0.3% | Sep-08 | ||||||||||||||||||||||
| Natural Gas-Fired | 509 thousand MWh | 0.7% | Sep-08 | ||||||||||||||||||||||
| Coal-Fired | 3,280 thousand MWh | 2.0% | Sep-08 | ||||||||||||||||||||||
| Nuclear | 4,524 thousand MWh | 6.8% | Sep-08 | ||||||||||||||||||||||
| Hydroelectric | 103 thousand MWh | 0.6% | Sep-08 | ||||||||||||||||||||||
| Other Renewables | 152 thousand MWh | 1.9% | Sep-08 | ||||||||||||||||||||||
| Stocks | South Carolina | Share of U.S. | Period | ||||||||||||||||||||||
| Motor Gasoline (Excludes Pipelines) | 813 thousand barrels | 1.4% | Sep-08 | ||||||||||||||||||||||
| Distillate Fuel Oil (Excludes Pipelines) | 415 thousand barrels | 0.4% | Sep-08 | ||||||||||||||||||||||
| Natural Gas in Underground Storage | — | — | Sep-08 | ||||||||||||||||||||||
| Petroleum Stocks at Electric Power Producers | 823 thousand barrels | 2.1 % | Sep-08 | ||||||||||||||||||||||
| Coal Stocks at Electric Power Producers | 2,198 thousand tons | 1.5% | Sep-08 | ||||||||||||||||||||||
| Production Facilities | South Carolina | ||||||||||||||||||||||||
| Major Coal Mines | None | ||||||||||||||||||||||||
| Petroleum Refineries | None | ||||||||||||||||||||||||
| Major Non-Nuclear Electricity Generating Plants | Bad Creek (Duke Energy Carolinas • LLC) • Cross (South Carolina Pub Serv Auth) • Winyah (South Carolina Pub Serv Auth) • John S Rainey (South Carolina Pub Serv Auth) • Broad River Energy Center (Calpine Operating Services Company Inc) | ||||||||||||||||||||||||
| Nuclear Power Plants | Oconee (Duke Energy Carolinas • LLC) • Catawba (Duke Energy Carolinas • LLC) • V C Summer (South Carolina Electric&Gas Co) • H B Robinson (Progress Energy Carolinas Inc) | ||||||||||||||||||||||||
| Distribution & Marketing | ||||
| Distribution Centers | South Carolina | |||||||||
| Oil Seaports/Oil Import Sites | Charleston • Greenville-Spartanburg. | |||||||||
| Natural Gas Market Centers | None | |||||||||
| Major Pipelines | South Carolina | |||||||||
| Crude Oil | None | |||||||||
| Petroleum Product | Colonial • Plantation. | |||||||||
| Liquefied Petroleum Gases | Dixie | |||||||||
| Interstate Natural Gas Pipelines | Southern Natural Gas Co. • Transcontinental Gas Pipeline Co. | |||||||||
| Fueling Stations | South Carolina | Share of U.S. | Period | |||||||
| Motor Gasoline | 3,677 | 2.2% | 2007 | |||||||
| Liquefied Petroleum Gases | 27 | 1.2% | 2007 | |||||||
| Compressed Natural Gas | 3 | 0.4% | 2007 | |||||||
| Ethanol | 55 | 3.9% | 2007 | |||||||
| Other Alternative Fuels | 73 | 6.3% | 2007 | |||||||
| Consumption | ||||
| per Capita | South Carolina | U.S. Rank | Period | |||||||
| Total Energy | 394 million Btu | 15 | 2006 | |||||||
| by Source | South Carolina | Share of U.S. | Period | |||||||
| Total Energy | 1,708 trillion Btu | 1.7% | 2006 | |||||||
| Total Petroleum | 109,208 thousand barrels | 1.4% | 2006 | |||||||
| Motor Gasoline | 61,779 thousand barrels | 1.8% | 2006 | |||||||
| Distillate Fuel | 21,812 thousand barrels | 1.4% | 2006 | |||||||
| Liquefied Petroleum Gases | 3,243 thousand barrels | 0.4% | 2006 | |||||||
| Jet Fuel | 1,805 thousand barrels | 0.3% | 2006 | |||||||
| Natural Gas | 174,805 million cu ft | 0.8% | 2006 | |||||||
| Coal | 17,288 thousand short tons | 1.6% | 2006 | |||||||
| by End-Use Sector | South Carolina | Share of U.S. | Period | |||||||
| Residential | 349,144 billion Btu | 1.7% | 2006 | |||||||
| Commercial | 256,814 billion Btu | 1.4% | 2006 | |||||||
| Industrial | 653,789 billion Btu | 2.0% | 2006 | |||||||
| Transportation | 447,980 billion Btu | 1.6% | 2006 | |||||||
| for Electricity Generation | South Carolina | Share of U.S. | Period | |||||||
| Petroleum | 23 thousand barrels | 0.4% | Sep-08 | |||||||
| Natural Gas | 4,086 million cu ft | 0.7% | Sep-08 | |||||||
| Coal | 1,361 thousand short tons | 1.6% | Sep-08 | |||||||
| for Home Heating (share of households) | South Carolina | U.S. Avg. | Period | |||||||
| Natural Gas | 26% | 51.2% | 2000 | |||||||
| Fuel Oil | 5% | 9.0% | 2000 | |||||||
| Electricity | 58% | 30.3% | 2000 | |||||||
| Liquefied Petroleum Gases | 9% | 6.5% | 2000 | |||||||
| Other/None | 2% | 1.8% | 2000 | |||||||
| Environment | ||||
| Special Programs | South Carolina | |||||||||
| Clean Cities Coalitions | Palmetto State | |||||||||
| Alternative Fuels | South Carolina | Share of U.S. | Period | |||||||
| Alternative-Fueled Vehicles in Use | 9,642 | 1.6% | 2006 | |||||||
| Ethanol Plants | 0 | 0.0% | 2008 | |||||||
| Ethanol Plant Capacity | 0 million gal/year | 0.0% | 2008 | |||||||
| Ethanol Use in Gasohol | 0 thousand gal | 0.0% | 2004 | |||||||
| Electric Power Industry Emissions | South Carolina | Share of U.S. | Period | |||||||
| Carbon Dioxide |
40,847,197 metric tons | 1.7% | 2006 | |||||||
| Sulfur Dioxide |
218,658 metric tons | 2.3% | 2006 | |||||||
| Nitrogen Oxide |
49,251 metric tons | 1.3% | 2006 | |||||||
| — = No data reported; NA = Not available; W = Withheld to avoid disclosure of individual company data. |
|
||||||||||||||||||||||||||||||||||||||||||||||||||||||||||||||||||||||||||||||||||||||||||||||||||||||||||||||||||||||||||||||||||||||||||||||||||||||||||||||