 |
|
|||
State Energy Profile - AlabamaEnergy Information Administration - State Energy Profileshttp://tonto.eia.doe.gov/state |
||||||
|---|---|---|---|---|---|---|
|
||||||
|
Last Update: January 02, 2009
Next Update: January 08 , 2009 |
||||||
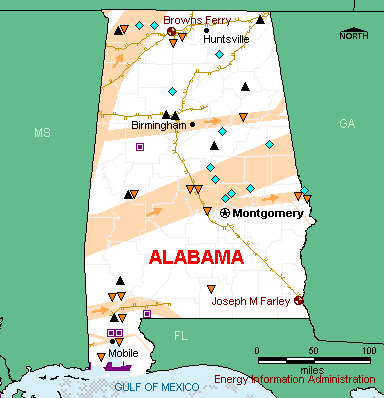
OverviewResources and ConsumptionAlabama is rich in energy resources. The State has considerable conventional and unconventional natural gas reserves, substantial deposits of coal, and numerous rivers capable of hydroelectric generation. Several regions of Alabama are well suited for growing switchgrass, making the State a potential site for the installation of bioenergy plants. With a strong manufacturing base in paper products, chemicals, and textiles, Alabama’s industrial sector leads State energy consumption, accounting for nearly one-half of total energy use. PetroleumAlabama produces a small amount of crude oil from reserves located in the Black Warrior Basin in the north and the Gulf Coast in the south. Although production has been in decline since the early 1990s, high oil prices have sparked new onshore drilling activity in recent years. To increase production from aging fields, producers have repaired old wells and applied new technology. One petroleum refinery is located near the Port of Mobile, and a second is located in Tuscaloosa on the Black Warrior River. A third refinery is located in Atmore in the southern part of the State. Alabama markets receive finished petroleum products from Texas and Louisiana through the Colonial and Plantation pipelines. Per capita petroleum consumption in Alabama is about average compared to other States. Natural GasAlabama’s annual natural gas production accounts for more than 1 percent of total U.S. output. More than one-half of this production typically comes from offshore wells, and more than one-third comes from coalbed methane deposits (unconventional natural gas found trapped within coal seams) in the Black Warrior Basin and the Cahaba Coal Field. As with oil production, Alabama’s natural gas production is in decline and does not satisfy all consumer demand, about three-fourths of which is from industrial users and electric power generators. Consequently, Alabama purchases additional supplies of natural gas transported by pipeline from Louisiana and Texas. Coal, Electricity, and RenewablesAlabama ranks high among States in electricity generation. Coal is the dominant fuel for electric power generation, typically accounting for more than one-half of the electricity produced within the State. Although Alabama produces large amounts of coal in the northern part of the State, industry consumes most of the State’s output. Coal used for electricity generation is shipped in from other States, primarily Wyoming and Kentucky. Alabama is a major nuclear power generator, and in 2005 its two nuclear power plants produced about one-fourth of the electricity generated in the State. The State’s nuclear power capacity is expected to expand in mid-2007 when the Tennessee Valley Authority (TVA) restarts a nuclear reactor at its Browns Ferry nuclear power plant that has been idle since 1985. With more than two dozen hydroelectric dams, located mainly along the Alabama and Coosa Rivers, Alabama is the one of the top producers of hydroelectric power east of the Rocky Mountains. Hydroelectric power typically supplies at least 6 percent of State electricity generation. Due to high demand from the industrial and residential sectors, Alabama’s total electricity consumption is high when compared to other States. Alabama’s per capita consumption of residential electricity is one of the highest in the country due to high air-conditioning demand during hot summer months and the widespread use of electricity for home heating during generally mild winter months. However, despite high total and per capita electricity demand, Alabama electricity production exceeds consumption and the State exports large amounts of electricity to neighboring States via several high-voltage interstate transmission lines. |
|
| Economy | ||||
| Population and Employment | Alabama | U.S. Rank | Period | |||||||
| Population | 4.7 million | 23 |
2008 | |||||||
| Civilian Labor Force | 2.2 million | 23 |
2007 | |||||||
| Per Capita Personal Income | $32,404 | 43 |
2007 | |||||||
| Industry | Alabama | U.S. Rank | Period | |||||||
| Gross Domestic Product by State | $165.8 billion | 25 | 2007 | |||||||
| Land in Farms | 8.9 million acres | 32 |
2002 | |||||||
| Market Value of Agricultural Products Sold | $3.3 billion | 23 |
2002 | |||||||
| Prices | ||||
| Petroleum | Alabama | U.S. Avg. | Period | |||||||
| Domestic Crude Oil First Purchase |
$74.8/barrel
|
$73.22/barrel | Oct-08 | |||||||
| No. 2 Heating Oil, Residential | — | $3.168/gal | Oct-08 | |||||||
| Regular Motor Gasoline Sold Through Retail Outlets (Excluding Taxes) | $2.607/gal | $2.527/gal | Oct-08 | |||||||
| State Tax Rate on Motor Gasoline (other taxes may apply) |
$0.18/gal | $0.2159/gal | Aug-08 | |||||||
| No. 2 Diesel Fuel Sold Through Retail Outlets (Excluding Taxes) | — | $3.021/gal | Oct-08 | |||||||
| State Tax Rate on On-Highway Diesel (other taxes may apply) |
$0.21/gal | $0.2214/gal | Aug-08 | |||||||
| Natural Gas | Alabama | U.S. Avg. | Period | |||||||
| Wellhead | $7.57/thousand cu ft | $6.40/thousand cu ft | 2006 | |||||||
| City Gate | $10.16/thousand cu ft | $7.88/thousand cu ft | Oct-08 | |||||||
| Residential | $24.50/thousand cu ft | $15.23/thousand cu ft | Oct-08 | |||||||
| Coal | Alabama | U.S. Avg. | Period | |||||||
| Average Open Market Sales Price | $55.56/short ton | $26.20/short ton | 2007 | |||||||
| Delivered to Electric Power Sector | $ 3.40/million Btu | $ 2.16 /million Btu | Sep-08 | |||||||
| Electricity | Alabama | U.S. Avg. | Period | |||||||
| Residential | 10.89 cents/kWh | 11.94 cents/kWh | Sep-08 | |||||||
| Commercial | 10.18 cents/kWh | 10.77 cents/kWh | Sep-08 | |||||||
| Industrial | 6.80 cents/kWh | 7.36 cents/kWh | Sep-08 | |||||||
|
|||||||||||||||||||||||||
| Reserves | Alabama | Share of U.S. | Period | ||||||||||||||||||||||
| Crude Oil | 42 million barrels | 0.2% | 2007 | ||||||||||||||||||||||
| Dry Natural Gas | 3,994 billion cu ft | 1.7% | 2007 | ||||||||||||||||||||||
| Natural Gas Liquids | 53 million barrels | 0.6% | 2007 | ||||||||||||||||||||||
| Recoverable Coal at Producing Mines | 327 million short tons | 1.7 % | 2007 | ||||||||||||||||||||||
| Rotary Rigs & Wells | Alabama | Share of U.S. | Period | ||||||||||||||||||||||
| Rotary Rigs in Operation | 5 | 0.3% | 2007 | ||||||||||||||||||||||
| Crude Oil Producing Wells | 832 | 0.2% | 2007 | ||||||||||||||||||||||
| Natural Gas Producing Wells | 6,227 | 1.4% | 2006 | ||||||||||||||||||||||
| Production | Alabama | Share of U.S. | Period | ||||||||||||||||||||||
| Total Energy | 1,602 trillion Btu | 2.3% | 2005 | ||||||||||||||||||||||
| Crude Oil | 646 thousand barrels | 0.4% | Aug-08 | ||||||||||||||||||||||
| Natural Gas - Marketed | 286,220 million cu ft | 1.5% | 2006 | ||||||||||||||||||||||
| Coal | 19,327 thousand short tons | NA | 2007 | ||||||||||||||||||||||
| Capacity | Alabama | Share of U.S. | Period | ||||||||||||||||||||||
| Crude Oil Refinery Capacity (as of Jan. 1) | 124,600 barrels/calendar day | 0.7% | 2008 | ||||||||||||||||||||||
| Electric Power Industry Net Summer Capability | 30,664 MW | 3.1% | 2006 | ||||||||||||||||||||||
| Net Electricity Generation | Alabama | Share of U.S. | Period | ||||||||||||||||||||||
| Total Net Electricity Generation | 12,121 thousand MWh | 3.6% | Sep-08 | ||||||||||||||||||||||
| Petroleum-Fired | 14 thousand MWh | 0.5% | Sep-08 | ||||||||||||||||||||||
| Natural Gas-Fired | 1,845 thousand MWh | 2.4% | Sep-08 | ||||||||||||||||||||||
| Coal-Fired | 6,213 thousand MWh | 3.8% | Sep-08 | ||||||||||||||||||||||
| Nuclear | 3,409 thousand MWh | 5.1% | Sep-08 | ||||||||||||||||||||||
| Hydroelectric | 310 thousand MWh | 1.9% | Sep-08 | ||||||||||||||||||||||
| Other Renewables | 316 thousand MWh | 3.9% | Sep-08 | ||||||||||||||||||||||
| Stocks | Alabama | Share of U.S. | Period | ||||||||||||||||||||||
| Motor Gasoline (Excludes Pipelines) | 1,215 thousand barrels | 2.0% | Oct-08 | ||||||||||||||||||||||
| Distillate Fuel Oil (Excludes Pipelines) | 1,007 thousand barrels | 1.1% | Oct-08 | ||||||||||||||||||||||
| Natural Gas in Underground Storage | 21,949 million cu ft | 0.3% | Oct-08 | ||||||||||||||||||||||
| Petroleum Stocks at Electric Power Producers | 147 thousand barrels | 0.4 % | Sep-08 | ||||||||||||||||||||||
| Coal Stocks at Electric Power Producers | 3,686 thousand tons | 2.5% | Sep-08 | ||||||||||||||||||||||
| Production Facilities | Alabama | ||||||||||||||||||||||||
| Major Coal Mines | None | ||||||||||||||||||||||||
| Petroleum Refineries | Goodway Refining LLC (Atmore) • Hunt Refining Co (Tuscaloosa) • Shell Chemical LP (Saraland) | ||||||||||||||||||||||||
| Major Non-Nuclear Electricity Generating Plants | James H Miller Jr (Alabama Power Co) • Barry (Alabama Power Co) • E C Gaston (Alabama Power Co) • Widows Creek (Tennessee Valley Authority) • Colbert (Tennessee Valley Authority) | ||||||||||||||||||||||||
| Nuclear Power Plants | Browns Ferry (Tennessee Valley Authority) • Joseph M Farley (Alabama Power Co) | ||||||||||||||||||||||||
| Distribution & Marketing | ||||
| Distribution Centers | Alabama | |||||||||
| Oil Seaports/Oil Import Sites | Mobile | |||||||||
| Natural Gas Market Centers | None | |||||||||
| Major Pipelines | Alabama | |||||||||
| Crude Oil | Citronelle-Mobile • Genesis • Hess • Hunt • Miller. | |||||||||
| Petroleum Product | Amoco • Colonial • Plantation. | |||||||||
| Liquefied Petroleum Gases | Dixie • Enterprise | |||||||||
| Interstate Natural Gas Pipelines | Chandeleur Pipeline Co. • Enbridge Pipelines • Florida Gas Transmission Co. • Gulf South Pipeline Co. • Gulfstream Natural Gas System • Southern Natural Gas Co. • Tennessee Gas Pipeline Co. • Texas Eastern Transmission Co. • Transcontinental Gas Pipeline Co. | |||||||||
| Fueling Stations | Alabama | Share of U.S. | Period | |||||||
| Motor Gasoline | 6,200 | 3.8% | 2007 | |||||||
| Liquefied Petroleum Gases | 46 | 2.0% | 2007 | |||||||
| Compressed Natural Gas | 3 | 0.4% | 2007 | |||||||
| Ethanol | 4 | 0.3% | 2007 | |||||||
| Other Alternative Fuels | 13 | 1.1% | 2007 | |||||||
| Consumption | ||||
| per Capita | Alabama | U.S. Rank | Period | |||||||
| Total Energy | 466 million Btu | 7 | 2006 | |||||||
| by Source | Alabama | Share of U.S. | Period | |||||||
| Total Energy | 2,140 trillion Btu | 2.2% | 2006 | |||||||
| Total Petroleum | 115,943 thousand barrels | 1.5% | 2006 | |||||||
| Motor Gasoline | 63,465 thousand barrels | 1.9% | 2006 | |||||||
| Distillate Fuel | 30,040 thousand barrels | 2.0% | 2006 | |||||||
| Liquefied Petroleum Gases | 3,391 thousand barrels | 0.5% | 2006 | |||||||
| Jet Fuel | 2,313 thousand barrels | 0.4% | 2006 | |||||||
| Natural Gas | 391,098 million cu ft | 1.7% | 2006 | |||||||
| Coal | W | W | 2006 | |||||||
| by End-Use Sector | Alabama | Share of U.S. | Period | |||||||
| Residential | 401,115 billion Btu | 1.9% | 2006 | |||||||
| Commercial | 275,741 billion Btu | 1.6% | 2006 | |||||||
| Industrial | 965,550 billion Btu | 3.0% | 2006 | |||||||
| Transportation | 498,067 billion Btu | 1.7% | 2006 | |||||||
| for Electricity Generation | Alabama | Share of U.S. | Period | |||||||
| Petroleum | 28 thousand barrels | 0.6% | Sep-08 | |||||||
| Natural Gas | 13,882 million cu ft | 2.2% | Sep-08 | |||||||
| Coal | 3,020 thousand short tons | 3.5% | Sep-08 | |||||||
| for Home Heating (share of households) | Alabama | U.S. Avg. | Period | |||||||
| Natural Gas | 38% | 51.2% | 2000 | |||||||
| Fuel Oil | 0% | 9.0% | 2000 | |||||||
| Electricity | 46% | 30.3% | 2000 | |||||||
| Liquefied Petroleum Gases | 14% | 6.5% | 2000 | |||||||
| Other/None | 2% | 1.8% | 2000 | |||||||
| Environment | ||||
| Special Programs | Alabama | |||||||||
| Clean Cities Coalitions | None | |||||||||
| Alternative Fuels | Alabama | Share of U.S. | Period | |||||||
| Alternative-Fueled Vehicles in Use | 8,935 | 1.5% | 2006 | |||||||
| Ethanol Plants | 0 | 0.0% | 2008 | |||||||
| Ethanol Plant Capacity | 0 million gal/year | 0.0% | 2008 | |||||||
| Ethanol Use in Gasohol | 31,384 thousand gal | 0.9% | 2004 | |||||||
| Electric Power Industry Emissions | Alabama | Share of U.S. | Period | |||||||
| Carbon Dioxide |
85,116,254 metric tons | 3.5% | 2006 | |||||||
| Sulfur Dioxide |
457,504 metric tons | 4.8% | 2006 | |||||||
| Nitrogen Oxide |
122,275 metric tons | 3.2% | 2006 | |||||||
| — = No data reported; NA = Not available; W = Withheld to avoid disclosure of individual company data. |
|
||||||||||||||||||||||||||||||||||||||||||||||||||||||||||||||||||||||||||||||||||||||||||||||||||||||||||||||||||||||||||||||||||||||||||||||||||||||||||||||