|
publications > poster > hydrodynamics of the southwest coast estuaries
Hydrodynamics of the Southwest Coast Estuaries
Principal Investigators: Eduardo Patino, Lars Soderqvist, and Victor Levesque

[larger image]
|
This study is a part of the U.S. Geological Survey South Florida Ecosystems Initiative and Place Based Systems programs.
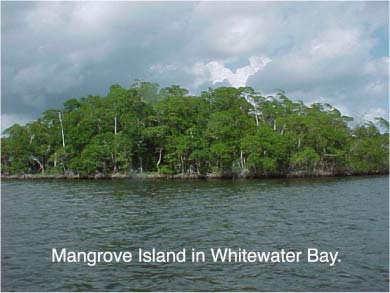
The study provides information about the hydrodynamics of estuarine rivers along the southwest coast of Everglades National Park.
The river discharges reaching the estuaries on the southwest coast are an important consideration facing resource management of the Everglades. |
Southwest Coast Study status
Boundary Water Level and Salinity Stations
Shark Point started February 2001
Chatham River entrance started March 2001 |

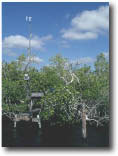
Boundary station off Shark Point. [larger image]
|
River Level and Salinity Stations
Barron River started May 2001
Turner River started May 2001
Lopez River started April 2001
New River started April 2001 |
Discharge stations
Chatham River installed March 2001
Lostman's River installed March 2001
Lostman's Creek discontinued (April 1999 - May 2001)
Broad River station moved downstream February 2001
Broad River upstream station discontinued (January 1997 - May 2001)
Harney River station discontinued (January 1997 - March 2001)
Shark River station started November 1996
North River station started April 1999 |

Broad River discharge station. [larger image]
|
Southwest Coast Discharge Stations Mean and Median Residual Discharges.
CY = Calendar Year (Jan 1 - Dec 31).
WY = Water Year (Oct 1 - Sep 30).
Mean Residual Discharge in cubic feet per second.
|
Station Name
|
CY97
|
CY98
|
CY99
|
|
Broad River
|
181
|
233
|
329
|
|
Harney River
|
224
|
147
|
353
|
|
Shark River
|
266
|
186
|
314
|
| Calendar Year mean residual discharge values for stations. |
|
Station Name
|
WY97
|
WY98
|
WY99
|
|
Broad River
|
149
|
219
|
281
|
|
Harney River
|
206
|
137
|
424
|
|
Shark River
|
242
|
196
|
279
|
| Water Year mean residual discharge values for stations. |
Median Residual Discharge in cubic feet per second.
|
Station Name
|
CY97
|
CY98
|
CY99
|
|
Broad River
|
156
|
217
|
261
|
|
Harney River
|
153
|
101
|
262
|
|
Shark River
|
223
|
148
|
216
|
| Calendar Year median residual discharge values for stations. |
|
Station Name
|
WY97
|
WY98
|
WY99
|
|
Broad River
|
123
|
184
|
254
|
|
Harney River
|
145
|
58
|
378
|
|
Shark River
|
204
|
146
|
212
|
| Water Year median residual discharge values for stations. |
| Discharge stations are equiped with velocity, water level, temperature, and salinity sensors.
Data is collected every 15 minutes.
Velocity ratings are developed for each station using discharge measurements and station instrument data. |
|
Broad River station Velocity Rating

[larger image]
|
|
Harney River station Velocity Rating
[larger image]
|
Shark River station Velocity Rating

[larger image]
|
| Instantaneous discharge for each 15 minute interval is calculated for each station (blue line in figure below).
Instantaneous discharge is filtered using a low-pass filter to remove semi-diurnal tidal frequencies.
The residual discharge data reveal responses to meteorological and long-term tidal forcing (red line in figure below). |
|
Instantaneous and Residual Discharges

[larger image]
|
North River station.
[larger image]
|
| Mean and median discharge for calendar years (January - December) or water years (October - September) can help determine effects of upgradient water delivery modifications.
Annual mean and median discharges are remarkably similar in magnitude.
Annual mean discharges for 1998 are the lowest for the period of record, while annual mean discharges for 1999 are the highest for the period of record. |
|
Southwest Coast Residual Discharges, 1997-1999

[larger image]
|
 Click here for a printable version of this poster (note: document will open in a new browser window) Click here for a printable version of this poster (note: document will open in a new browser window)
Related information:
SOFIA Projects:
Southwest Florida Coastal and Wetland Systems Monitoring
Water Flows and Nutrient Fluxes to the Southwest Coast of Everglades National Park, Florida
|