III. A Primer on Imaging Theory: What to expect from imagery
Knowledge of the imaging process can help formulate reasonable expectations for airborne imagery. The imaging process is imperfect and thus produces an abstraction of reality. To the analyst this means that there will always be recognizable characteristics of the electro-optical imaging process present.
Imaging theory uses linear systems concepts. The mathematical representation of the imaging process uses a convolution function. A graphical representation of the imaging process as a convolution without equations is sufficient to illustrate this concept. The imaging system is represented by a function (illustrated here by a non-symmetric function). The environmental "target" can also be represented by a function (here a symmetric, binomial distribution). Note that the imaging system is not represented as a "perfect", symmetric function or as a square wave. The scanner system function is normalized from 0.0 to 1.0. A scanner function value of 1.0 would indicate that the system perfectly transmits the input information signal (from the environmental target) to its electronic output form (a digital number). A value close to 0.0 indicates that the scanner system does a poor job of transmitting the input signal. If imaging systems were entirely perfect they would be represented as square waves: 1.0 or perfect signal transmitters.
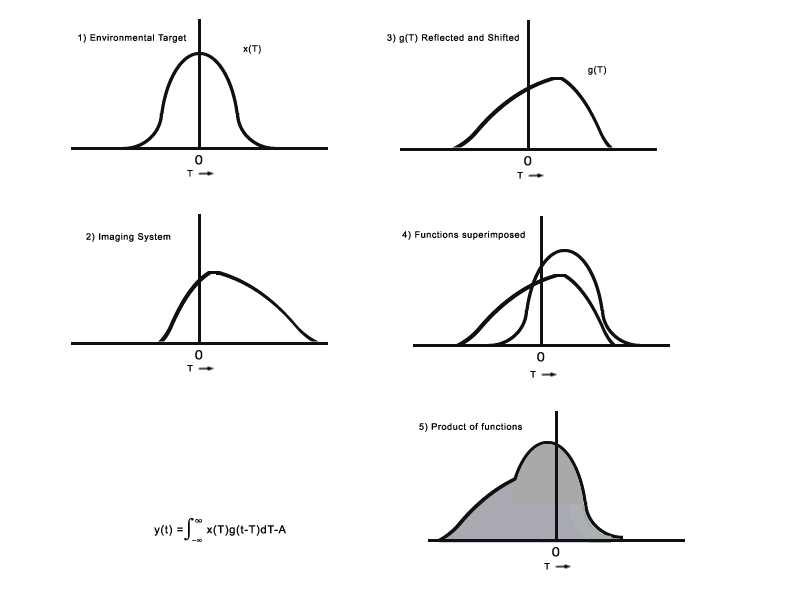
The process of scanning the target can be visualized as an integration of the two functions. The final result of this process is a third function with characteristics of both the scanner system and the environmental target. Given a system with a high S/N and thus high fidelity, the resulting output image (here represented as a function), would be a faithful or true representation of the environmental signal. Graphically, an output from a high fidelity system will be a function that looks very much like the input function. Note that if the input signal consists of the desired environmental signal (with its inherent noise), plus an atmospheric signal (more noise), the S/N going into the scanner is already be an issue. If the platform attitude is unstable, (adding more noise), and the scanning process adds its own noise, one can understand why S/N is a reasonable approach to airborne remote sensing.
What one can reasonably expect from imagery varies largely as a function of the system design. The Jet Propulsion Laboratory (JPL) Advanced Visible InfraRed Imaging Spectroradiometer (AVIRIS) is widely accepted to be state-of-the-art for airborne imaging devices available to the civilian environmental remote sensing community. With AVIRIS as the top-of-the-line and an analog video system as the other extreme, users of most airborne imaging systems can expect data quality that is somewhere between these two.
Silicon Detector Sensitivity Effects
Attention to silicon detector sensitivity is important when choosing spectral bands at the upper and lower limits of spectral sensitivity. A plot of the sensitivity of silicon by wavelength shows this graphically. Note the peak sensitivity of silicon in the visible wavelengths and the rapid fall-off of sensitivity for the UV and NIR. Decreased sensitivity translates to more noise. Unless a system is specifically configured to maximize S/N for the extreme UV and NIR, when specifying narrow bandwidth spectral channels, it is widely recommended that wavelengths below 500 nm and above 1000 nm be discarded. Scanners may be listed as being "sensitive" to wavelengths below 500 nm and above 1000 nm, however this does not always translate to good quality data. If data covering below 500 nm and above 1000 nm is needed, one can try broader spectral band widths to average out the noise.

Platform Nose Pitch Problems and Geometric Fidelity
A very difficult problem to diagnose is geometric distortion that occurs when the aircraft nose pitches downward while scanning. Airborne scanner systems use the scanning mechanism (electronic for push-broom systems or mirror sweep for whisk-broom systems) for the across-track image dimension and the forward motion of the aircraft for the along-track dimension of the image. If the aircraft nose pitches downward during the scanning process, the system continues to scan backwards off-nadir along track as the nose goes down. As the nose comes back up, the system is still scanning and re-scans off-nadir the same part of the landscape that was just scanned in the forward and backward directions. This is very difficult to identify visually, especially over crops. It is usually noticed if a ground feature appears in the imagery more than once.
Framing systems such as digital cameras are easier to geometrically rectify as every pixel of the image will have the same geometry at the time of acquisition. A rubber-sheet stretch usually does an acceptable correction for reasonably-level landscapes given suitable ground control tie points. Push-broom and whisk-broom scanning systems theoretically have a different solution for every pixel. Variations of roll, pitch and yaw in time affect each pixel as it is formed. Rubber-sheet stretches are typically more challenging to perform with such imagery. If the system is equipped with an Inertial Navigation System (INS) to measure and record platform roll, pitch and yaw periodically, first-order corrections for platform attitude changes can be automatically performed. Some additional corrections are still needed, however.
|