Poster Version
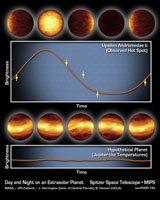
The top graph consists of infrared data from NASA's Spitzer Space
Telescope. It tells astronomers that a distant planet, called Upsilon
Andromedae b, always has a giant hot spot on the side that faces the star,
while the other side is cold and dark. The artist's concepts above the
graph illustrate how the planet might look throughout its orbit if viewed
up close with infrared eyes.
Spitzer was able to determine the difference in temperature between the
two sides of this planet by measuring the planet's infrared light, or
heat, at five points during its 4.6-day-long trip around its star. The
temperature rose and fell depending on which face, the sunlit or dark, was
pointed toward Spitzer's cameras. Those temperature oscillations are
traced by the wavy orange curve. They indicate that Upsilon Andromedae b
has an extreme range of temperatures across its surface, about 1,400
degrees Celsius (2,550 degrees Fahrenheit). This means that hot gas
moving across the bright side of the planet cools off by the time it
reaches the dark side.
The bottom graph and artist's concepts represent what astronomers might
have seen if the planet had bands of different temperatures girdling it,
like Jupiter. Some astronomers had speculated that "hot-Jupiter" planets
like Upsilon Andromedae b, which circle very closely around their stars,
might resemble Jupiter in this way. If Upsilon Andromedae b had been like
this, there would have been no difference between the average temperatures
of the sunlit and dark sides to detect, and Spitzer's data would have
appeared as a flat line.


