|
|
|
Metadata
|
|
ID
|
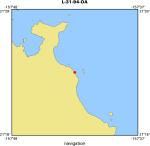
L-31-94-OA
|
|
Also Known As
|
OLNK1-3
|
|
Abstract
|
University of Hawaii,United States Geological Survey, Menlo
Park, California. Chief Scientist: Bruce Richmond. Geodetic
data (geodetic, navigation) of field activity L-31-94-OA in
Southeast Lanikai (3)Oahu, Hawaii from 08/03/1994 to
08/03/1994
|
|
Organization
|
University of Hawaii
United States Geological Survey, Menlo Park, California
|
|
Project/Theme
|
Hawaii Beach Monitoring Program
|
|
Chief Scientist
|
Bruce Richmond
|
|
Activity Type
|
Geodetic
|
|
Platform
|
Beach
|
|
Area of Operation
|
Southeast Lanikai (3)
Oahu, Hawaii
|
|
Location map
|
|
|
Bounding Coordinates
|
21.38828
-157.71168 -157.71168
21.38828
|
|
Dates
|
08/03/1994 (JD 215) to 08/03/1994 (JD 215)
|
|
Analog Materials
|
No analog holdings.
|
|
Index map

|
|
|
Information Specialist
|
|
|
Equipment Used
|
|
|
Purpose
|
Specific objectives include:
|
|
a) document the magnitude and extent of the erosion problem;
|
|
|
b) determine the individual causes for coastal erosion in the
|
Hawaiian Islands and establish their relative importance;
|
|
c) develop a coastal hazard database that can be applied to other
|
studies; and
|
|
d) provide input for predictive models on long-term coastal behavior.
|
|
|
|
The overall objectives of the Hawaii
|
|
Coastal Erosion Study are to document the recent history of shoreline
|
|
change in Hawaii and to determine the primary factor(s) responsible
|
|
for coastal erosion in low-latitude environments.
|
|
|
|
This project will integrate studies
|
|
of erosion history, large-scale coastal behavior, and the reef
|
|
record to develop a comprehensive model of coastal-systems evolution
|
|
with the goal of further enhancing our predictive capabilities
|
|
regarding shoreline stability in important low-latitude environments.
|
|
It is anticipated that results from this project can be applied
|
|
to low-latitude shorelines around the globe.
|
|
|
|
|
|
In an effort to establish baseline beach conditions, monitor
|
|
seasonal beach fluctuations, and understand the dynamics of beach
|
|
change in Hawaii, a program of beach and nearshore monitoring
|
|
was initiated in 1994 on the islands of Maui and Oahu. Five years
|
|
of biannual (approx. summer/winter) profiles on forty-two Oahu,
|
|
and thirty-seven Maui, beaches have been collected to date. In
|
|
order to address long-term change, we attempted to re-occupy
|
|
beach monitoring sites established by University of Hawaii researchers
|
|
during the early 1960s (Moberly and Chamberlain, 1964). However,
|
|
determining the exact location of old profile sites proved difficult
|
|
because of development along the coast and loss of the 1960s
|
|
reference marks. All new sites are referenced to a common GPS
|
|
network for accurate horizontal and vertical positioning.
|
|
|
|
This data set is intended for scientific research of beach
|
|
Morphology and volume changes.
|
|
|
Information to be Derived
|
|
The overall goals of this study are
|
|
to document the coastal erosion
|
|
history in Hawaii, determine the causal factors of that erosion,
|
|
provide high-quality data for other "end-users" in
|
|
applied studies (i.e. coastal engineers, planners, and managers),
|
|
and increase our general understanding of low-latitude coastal
|
|
geologic development. This project involves close cooperation
|
|
between the USGS Coastal and Marine Geology Program and the University
|
|
of Hawaii.
|
|
|
|
The data and results are presented as a web site (a separate
|
|
CDROM is also available). For the islands of Oahu and Maui,
|
|
Index maps show the location of the beach profile
|
|
monitoring sites. Each site is linked to a site map, photograph
|
|
of the area, collection of beach profiles, and the profile data.
|
|
|
Summary
|
|
Biannual beach profiles
|
|
were collected at 42 Oahu and 36 Maui
|
|
locations between August 1994 and August 1999. Surveys were
|
|
conducted at approximately summer-winter intervals and extend
|
|
from landward of the active beach to about -4 meters water depth.
|
|
Profile data on a CDROM are presented in both Microsoft EXCEL
|
|
97/98 & 5.0/95 Workbook (.xls) format and comma separated value
|
|
(.csv) format. Graphical representation of the surveys (x vs. z and
|
|
x vs. y) are presented in EXCEL format only. Site descriptions,
|
|
including beach location, directions to site, GPS information,
|
|
and a description of Reference Points used, are available in both
|
|
EXCEL and ADOBE ACROBAT .pdf format.
|
|
|
|
|
|
Coastal erosion is widespread and
|
|
locally severe in Hawaii and other low-latitude areas. Typical
|
|
erosion rates in Hawaii are in the range of 15 to 30 cm/yr (0.5
|
|
to 1 ft/yr; Hwang, 1981; Sea Engineering, Inc., 1988; Makai Ocean
|
|
Engineering, Inc. and Sea Engineering, Inc.,1991). Recent studies
|
|
on Oahu (Fletcher et al., 1997; Coyne et al., 1996) have shown
|
|
that nearly 24%, or 27.5 km (17.1 mi) of an original 115 km (71.6
|
|
mi) of sandy shoreline (1940's) has been either significantly
|
|
narrowed (17.2 km; 10.7 mi) or lost (10.3 km; 6.4 mi). Nearly
|
|
one-quarter of the islands' beaches have been significantly degraded
|
|
over the last half-century and all shorelines have been affected
|
|
to some degree. Oahu shorelines are by far the most studied,
|
|
however, beach loss has been identified on the other islands
|
|
as well, with nearly 13 km (8 mi) of beach likely lost due to
|
|
shoreline hardening on Maui (Makai Engineering, Inc. and Sea
|
|
Engineering, Inc., 1991).
|
|
|
|
|
|
Causes of coastal erosion and beach loss in Hawaii are numerous
|
|
but, unfortunately, poorly understood and rarely quantified.
|
|
Construction of shoreline protection structures limits coastal
|
|
land loss, but does not alleviate beach loss and may actually
|
|
accelerate the problem by prohibiting sediment deposition in
|
|
front of the structures. Other factors contributing to beach
|
|
loss include: a) reduced sediment supply; b) large storms; and,
|
|
c) sea-level rise. Reduction in sand supply, either from landward
|
|
or seaward (primarily reef) sources, can have a myriad of causes.
|
|
Obvious causes such as beach sand mining and emplacement of structures
|
|
that interrupt natural sediment transport pathways or prevent
|
|
access to backbeach sand deposits, remove sediment from the active
|
|
littoral system. More complex issues of sediment supply can be
|
|
related to reef health and carbonate production which, in turn,
|
|
may be linked to changes in water quality. Second, the accumulated
|
|
effect of large storms is to transport sediment beyond the littoral
|
|
system. Third, rising sea level leads to a natural landward migration
|
|
of the shoreline.
|
|
|
|
|
|
Dramatic examples of coastal erosion, such as houses and roads
|
|
falling into the sea, are rare in Hawaii, but the impact of erosion
|
|
is still very serious. The signs of erosion are much more subtle
|
|
and typically start as a "temporary" hardening structure
|
|
designed to mitigate an immediate problem which, eventually,
|
|
results in a proliferation of structures along a stretch of coast.
|
|
The natural ability of the sandy shoreline to respond to changes
|
|
in wave climate is lost.
|
|
|
Notes
|
|
Other field activities at Southeast Lanikai (3)
|
|
on Oahu also have Activity IDs beginning with "L-3" and ending with "-OA"
|
|
|
|
Cross-shore beach profile data were collected as a component of
|
|
the Hawaii Coastal Erosion Study, a cooperative effort by U.S.
|
|
Geological Survey and University of Hawaii in order to document
|
|
seasonal and longer-term variations in beach volume and behavior.
|
|
The overall objectives of the Hawaii Coastal Erosion Study are to
|
|
document the recent history of shoreline change in Hawaii and to
|
|
determine the primary factor(s) responsible for coastal erosion
|
|
in low-latitude environments for the purpose of predicting future
|
|
changes and to provide quality scientific data that is useful to
|
|
other scientists, planners, engineers, and coastal managers.
|
|
|
|
The overall strategy consists of first quantifying the magnitude
|
|
and location of serious erosion problems followed by close monitoring
|
|
of coastal change in critical areas. Bi-annual beach profiles have
|
|
been collected at over 40 critical beach sites on the islands of Oahu
|
|
and Maui. Once sufficient background information is analyzed and key
|
|
problems are defined, field sites will be selected for detailed process-
|
|
oriented studies (both physical and biological) to gain an understanding
|
|
of the complex relationships between reef carbonate production, sediment
|
|
dispersal, and the interaction of man-made structures with sediment
|
|
movement along the shore.
|
|
|
|
Information derived from this project will be used to develop general
|
|
guidelines for sediment production, transport, and deposition of low-
|
|
latitude coasts. Planned major products include a comprehensive atlas of
|
|
coastal hazards, journal articles and reports presenting results of our
|
|
studies, and a "living" database of shoreline history and changes based
|
|
on results of the beach profile monitoring and softcopy photogrammetric
|
|
analysis.
|
|
|
|
|
|
Cross shore beach profiles were measured using a Geodimeter
|
|
464 total station and swimming rodman. The total station was
|
|
set up at a non-specific position on the beach. Up to five
|
|
permanent reference points were first surveyed in order to
|
|
establish the position of the station relative to the established
|
|
profile line. Beach profile measurements were then taken from
|
|
a point landward of the active beach to as far offshore as
|
|
conditions would allow (typically -4m water depth). Specific
|
|
morphologic features (high water, berm crest, top of beach toe,
|
|
etc.) were noted. Data were post-processed as follows Survey data
|
|
were downloaded from the Total Station memory, automatically
|
|
creating a RAW file and an associated JOB file. The RAW file
|
|
was used to generate a PTS file (UTM field coordinates are
|
|
extracted from the RAW file) Note: no recalculation is performed
|
|
on the original file). PFCODE.EXE was used on the JOB file to
|
|
generate an ED file. The ED file was edited to include necessary
|
|
Program 10 information, Points block listing, and INFO codes.
|
|
Field procedures were checked and corrected as necessary.
|
|
PFGD.EXE was used on the ED file to generate a PF file (Cartesian-
|
|
based, relative XYZ coordinates). Extraneous lines were removed
|
|
from the PF file to generate a DAT file (relative XYZ coordinates) DAT
|
|
files were compiled into a SUMMARY file (Excel) format, plotted,
|
|
and where necessary, corrected relative to a primary reference point.
|
|
Where GPS positions of the reference points were available, the entire
|
|
summary file was re-referenced to an absolute vertical elevation
|
|
(meters above the Local Hawaii Tidal datum).
|
|
|
Got Help?
|
For L-31-94-OA, we would appreciate any information on -- analog materials, contract, crew, days at sea, dive count, funding, kms of navigation, national plan, NGDC Info, owner, ports, project number, publications, scanned materials, seismic description, station count, station description, submersible, tabulated info.
|
|