|
STYRENE
| Method no.: |
09 |
|
| Matrix: |
Air |
|
| Target concentration: |
100 ppm (425 mg/m3) (OSHA PEL - TWA) |
|
| Procedure: |
Collection on coconut shell charcoal tubes, desorption with carbon disulfide, and analysis by gas chromatography using a flame ionization detector. |
|
Recommended air volume
and sampling rate: |
10 L at 0.2 L/min - TWA |
|
15 L at 1.0 L/min - Ceiling or Peak |
|
Detection limit of
overall procedure: |
0.11 ppm (0.47 mg/m3) |
|
Reliable quantitation
limit: |
3.1 ppm (13 mg/m3) |
|
Standard error of estimate
at the TWA-PEL:
(Section 4.7.) |
6.69% |
|
| Special requirements: |
A 10-L air volume is highly recommended for TWA sampling due to non-linearity of desorption at low loadings of styrene. |
|
| Status of method: |
Sampling and analytical method which has been subjected to the established evaluation procedures of the Organic Methods Evaluation Branch. |
|
| Date: February 1980 |
Chemist: Mike Shulsky |
Organic Methods Evaluation Branch
OSHA Analytical Laboratory
Salt Lake City, Utah
1. General Discussion
1.1. Background
1.1.1. History
The charcoal tube collection procedure and gas chromatography (GC) analytical method have been in use for many years (Ref. 5.1.). Prior to charcoal tube collection, other solid sorbents and impingers were used (Ref. 5.2.). Before the use of gas chromatography for analysis of styrene, chemical techniques and ultraviolet spectrophotometry were used (Ref. 5.3.). There have been questions from field personnel as to the possibility of styrene polymerizing or decomposing after collection on charcoal or desorption. In addition to the normal validation tests, three studies were performed to investigate this possibility. The results are reported in Section 4.8. The styrene used in this validation was vacuum distilled to assure purity.
1.1.2. Toxic effects (This section is for information only and should not be taken as the basis of OSHA policy).
Styrene causes irritation of the eyes and mucous membranes at 50-100 ppm (Ref. 5.4.). It is a central nervous system depressant and may cause dermatitis after repeated exposures. At high levels (10,000 ppm), rats and guinea pigs became comatose after several min and died after 30 to 60 min of exposure. At 2,500 ppm, animals became weak, developed tremors, then became comatose and died after 8 h of exposure (Ref. 5.5.).
1.1.3. Use and operations where exposure may occur
Styrene exposure may occur in the manufacture of styrene, styrene-butadiene polymers, or in processes using the styrene-butadiene elastomer (rubber). There are approximately 3 billion pounds of styrene-butadiene elastomer manufactured each year. Most of this is used in the automobile tire industry, but a significant amount is used for other rubber products. Besides the styrene-butadiene elastomer, there are copolymers of styrene-butadiene which are used as carpet back coatings, paper coatings, pipe fittings, and packaging materials (Ref. 5.4.).
1.1.4. Number of workers that are exposed
NIOSH estimates there are 10,000 people employed in the manufacture of styrene-butadiene polymers alone (Ref. 5.4.).
1.1.5 Physical properties
Unless otherwise stated, the data are from Ref. 5.6.
| molecular weight: |
104.14 |
| boiling point: |
145-146°C |
| color: |
colorless to yellow |
| odor: |
penetrating |
| odor threshold: |
0.1 ppm (Ref. 5.5.) |
| lower explosive limit: |
1.1% (by volume in air) (Ref. 5.7.) |
| flash point: |
94°F (tag open cup) (Ref. 5.7.) |
| density: |
0.9045 (Ref. 5.8.) |
| vapor pressure: |
4.5 mm at 20°C (Ref. 5.7.) |
| synonyms: |
vinyl benzene, phenylethylene, cinnamene (Ref. 5.8.) |
1.2. Limit defining parameters
1.2.1. Detection limit of the analytical method
The detection limit was determined by making a 1.0-µL injection of an analytical standard at 1.8 µg styrene/mL. Therefore, the detection limit is 1.8 ng per injection (Section 4.1.). This is the amount of analyte which will give a peak whose height is 5 times the height of the baseline noise.
1.2.2. Detection limit of the overall procedure
The detection limit is 4.7 µg/sample, which corresponds to 0.11 ppm or 0.47 mg/m3 assuming a 10-L air volume. This value is the amount of styrene spiked on a charcoal tube which allows recovery of an amount equal to the detection limit of the analytical method. (Section 4.2.)
1.2.3. Reliable quantitation limit
The reliable quantitation limit is 134 µg/sample, which corresponds to 3.1 ppm or 13 mg/m3 with a 10-L air volume. This is the smallest amount of styrene which can be quantitated within both requirements of 75% recovery and a 95% confidence limit of no more than ±25%. (Section 4.3.)
The reliable quantitation limit and detection limits reported in this method are based upon the optimization of the instrument for the smallest possible amount of styrene. Since the TWA-PEL is much higher than the detection limits stated above, these values may not be attainable under routine operating conditions.
1.2.4. Sensitivity
The sensitivity of the analytical method over the concentration range representing 0.5 to 2 times the TWA-PEL, based on a 10-L air volume, is 788 area units per µg/mL. This value is the slope of the calibration curve (Section 4.4.). The sensitivity will vary with the particular instrument and area integration technique used in the analysis.
1.2.5. Recovery
The recovery of styrene from spiked samples over the range of 0.5 to 2 times the TWA-PEL based on a 10-L air volume is 92.4% (Section 4.5.). The recovery over the 15-day storage period remained above 85% for samples generated at 416 mg/m3 (Section 4.7.).
1.2.6. Precision of the analytical procedure
The pooled coefficient of variation is 0.007. This value was obtained by replicate determinations of analytical standards at 0.5, 1, and 2 times the TWA-PEL (Section 4.4.).
1.2.7. Precision of the overall procedure
The precision at the 95% confidence level for the 15-day storage test is ±14.3% (Section 4.7.). This includes an additional ±5% for sampling error.
1.3. Advantages
1.3.1. The sampling procedure is convenient. The pumps and charcoal tubes are portable.
1.3.2. The analytical method is sensitive, flexible, and reproducible.
1.3.3. The samples can be reanalyzed.
1.3.4. Samples are stable for at least two weeks.
1.3.5. Other compounds can be analyzed along with styrene.
1.4. Disadvantages
1.4.1. Many organic vapors will collect on charcoal, therefore, significant sources of other organic vapors in the area being sampled should be identified and listed as possible interferences.
1.4.2. Nonlinearity of desorption efficiencies at low loadings of styrene may result in the necessity of preparing a percent desorption vs. loading calibration curve.
1.4.3. Precision of flow rates on the sampling pump is dependent on the pressure drop across the charcoal tube.
2. Sampling Procedure
2.1. Apparatus
2.1.1. An approved personal sampling pump which has been calibrated within ±5% of the recommended flow rate, with the sampling device attached.
2.1.2. Coconut shell charcoal tubes; glass tubes 7-cm long, 6-mm o.d. and 4-mm i.d., containing a 100-mg section and a 50-mg section, heat-sealed at both ends. For this validation, SKC tubes were used.
2.2. Reagents
None required
2.3. Sampling procedure
2.3.1. Immediately before sampling, break the ends of the charcoal tube. All tubes must be from the same lot of charcoal.
2.3.2. Connect the charcoal tube to the pump with a short piece of flexible tubing. The 50-mg portion of the charcoal tube is used as the backup section, therefore, it should be placed nearer the pump.
2.3.3. The tube should be positioned vertically to avoid channeling through the charcoal.
2.3.4. Air being sampled should not pass through any hose or tubing before entering the charcoal tube.
2.3.5. Immediately after sampling, seal the ends of the tubes with the plastic caps.
2.3.6. With each set of samples, submit at least one blank charcoal tube from the same lot as the sample tubes. The blank tube should be treated in the same manner as the samples (break ends, seal, transport) except no air is drawn through it.
2.3.7. Transport the samples and corresponding paperwork to the lab for analysis.
2.3.8. If bulk samples are to be submitted for analysis, they should be sent in glass bottles with Teflon-lined caps. Bulk samples must be sent in a separate mailing package from any air samples.
2.4. Breakthrough
2.4.1. Studies to determine the 5% breakthrough value were done at twice the TWA-PEL. The relative humidity was 75% and the flow rate through the 100-mg portion of the charcoal tube was 0.2 L/min. The average breakthrough time was 176 min, and the average capacity of the charcoal was 30 mg. (Section 4.5.)
2.4.2. Another breakthrough study was conducted at the PEL for ceiling samples. The difference between this and the previous breakthrough study was that the flow rate for this was 1.01 L/min. The breakthrough time was 33 min and the capacity of the charcoal was 29 mg. (Section 4.5.)
2.5. Desorption efficiency
The desorption efficiency was determined at several loadings of styrene by liquid injection onto the 100-mg portion of the charcoal tubes. At 0.5, 1, and 2 times the TWA-PEL, based on 10 L of air, the desorption efficiency averaged 92.4%, but at lower loadings, the desorption efficiency became concentration dependent. (Section 4.6.) Desorption efficiencies will also vary from lab to lab and from one lot of charcoal to another.
2.6. Recommended air volume and sampling rate
2.6.1. The recommended air volume for TWA-PEL samples is 10 L at a sampling rate of 0.2 L/min.
2.6.2. The recommended air volume for ceiling samples is 15 L at 1.0 L/min.
2.7. Interferences
Since charcoal will collect many organic vapors, all organics being used in significant amounts near the sampling area should be listed as possible interferences.
2.8. Safety precautions
2.8.1. Wear eye protection when breaking the ends of the charcoal tubes.
2.8.2. Place the sampling pump on the employee in a manner so as not to interfere with the work being done.
2.8.3. Place the charcoal tube in a holder so the broken ends are not exposed while sampling.
3. Analytical Method
3.1. Apparatus
3.1.1. Gas chromatograph with a flame ionization detector.
3.1.2. A GC column capable of separating CS2, styrene, an internal standard, and possible interferences. For this validation, a 1/8-in. × 10-ft stainless steel column packed with 10% SP1000 on 80/100 mesh Supelcoport was used.
3.1.3. A suitable method for measuring peak areas.
3.1.4. Small vials with Teflon-lined caps for desorption of charcoal. Two-milliliter vials are preferable.
3.1.5. Microliter syringes such as 10-µL for preparing standards and 1.0-µL for sample injection.
3.1.6. Pipettes for dispensing the desorbing solution. A 1.0-mL reagent dispenser is convenient.
3.1.7. Volumetric flasks such as a 5.0-mL or larger for standard preparation.
3.2. Reagents
3.2.1. Carbon disulfide, reagent grade.
3.2.2. Styrene, reagent grade.
3.2.3. Internal standard compound such as ethyl benzene, reagent grade.
3.2.4. Desorbing solvent made at 1.0 µL internal standard per milliliter CS2.
3.2.5. GC grade helium, hydrogen, and air.
3.3. Standard preparation
3.3.1. Standards are prepared in the desorbing solvent.
3.3.2. A standard prepared at 1.0 µL styrene per milliliter desorbing solvent is equal to 0.9045 mg/mL. Assuming a 10-L air volume, 1.0-mL desorption volume, and 100% desorption, a sample at this solution concentration would be equivalent to an air concentration of 0.9045 mg/0.01 m3 which equals 90.45 mg/m3 or 21.3 ppm. This ppm value should be calibrated to the area determined for the styrene peak on the chromatogram.
3.4. Sample preparation
3.4.1. The 100-mg portion of the charcoal tube is placed in one vial while the 50-mg portion is placed in a separate vial. The glass wool and urethane plugs are discarded.
3.4.2. One mL of desorbing solvent is placed in each vial.
3.4.3. The vials are immediately capped and shaken periodically over a 30-min span before analysis.
3.5. Analysis
3.5.1. GC conditions
| oven temperature: |
130°C |
| injector temperature: |
175°C |
| detector temperature: |
200°C |
| carrier gas (helium): |
20 mL/min |
| detector gases - |
|
| hydrogen: |
23 mL/min |
| air: |
250 mL/min |
| injection size: |
1.0 µL |
| chromatogram: |
(Figure 4.13.) |
3.5.2. Peak areas are measured by a suitable technique.
3.5.3. An internal standard method is preferable. The integration of the peak areas can be calibrated so the results are in ppm for a 10-L air volume, 100% desorption, and 1-mL desorption volume.
3.5.4. Any sample above the PEL (TWA, ceiling or peak) must be confirmed by GC/MS or another suitable method. Retention time on one column is not considered proof of identity.
3.6. Interferences
3.6.1. Any compound which has the same retention time as styrene or the internal standard on the column being used will cause interference. This problem can frequently be alleviated by changing the GC conditions or the column.
3.6.2. The desorbing solvent generally will contain trace impurities, but these are not significant at the normal operating levels.
3.7. Calculations
3.7.1. The values, ppm, calculated by an integration method which assumes a 10-L air volume, 100% desorption, and 1.0-mL desorption volume, should be corrected for a desorption efficiency of 92.4% if those ppm values are 30.3 ppm (1.395 mg on the tube) or higher (Section 4.6.). The air volume correction is made by dividing the air volume taken by the assumed 10 L, then dividing this result into the ppm value which has been corrected for desorption.
Example: Integration method gave 55 ppm for a sample with a 22-L air volume.
|
air volume |
|
| desorption |
correction factor |
ppm |
|
| 55/0.924 = 59.5 |
22/10 = 2.2 |
59.5/2.2 = 27 |
|
| 27 ppm is reported for the sample. |
3.7.2. If the values from the integration method are less than 30.3 ppm, then these values may be corrected by substituting them as the "x" variable in the equation from Figure 4.12., Y = A(x2) + Bx + C using the coefficients as shown on the figure. The value of "Y" calculated from this equation will be the ppm concentration corrected for desorption. The air volume correction is made in the same manner as Section 3.7.1. (Section 4.6.)
Example: Integration method gave 15 ppm for a sample with an 8-L air volume.
x = 15 ppm (uncorrected for desorption)
desorption correction
| Y |
= |
A(x2) + Bx + C |
| Y |
= |
(-0.00342929)(152) + (1.20929)(15) + 0.120772 |
| Y |
= |
-0.7716 + 18.139 + 0.120772 |
| Y |
= |
17.49 ppm (corrected for desorption) |
air volume correction
| 8 L/10 L = 0.8 |
17.49 ppm/0.8 = 21.9 ppm |
|
| 21.9 ppm is reported for the sample. |
3.8. Safety precautions
3.8.1. Work in a hood when using solvents during sample and standard preparation.
3.8.2. Keep volumetrics and vials containing solvents away from sources of high temperatures such as detectors and injectors.
3.8.3. Avoid skin contact with solvents.
3.8.4. Wear safety glasses at all times.
4. Backup Data
4.1. Detection limit of the analytical method
This detection limit was established by injecting 1.0 µL of an analytical standard of 1.8 µg/mL concentration into a gas chromatograph. Therefore, the analytical detection limit is 1.8 ng/injection (Figure 4.1.).
4.2. Detection limit of the overall procedure
This limit was found by plotting the amount of styrene spiked on the 100-mg portion of the charcoal tube against the amount recovered (Figure 4.2.). By substituting 1.8 µg as the "x" value of the equation for Figure 4.2., a "Y" value or µg spiked on charcoal of 4.7 µg is obtained. Therefore, 4.7 µg of styrene must be on a charcoal tube in order to get 1.8 µg into solution. Assuming a 10-L air volume, this detection limit is 0.0047 mg/0.01 m3 which equals 0.47 mg/m3 or 0.1 ppm.
Table 4.2.
Recovery of Styrene at Low Sampler Loadings
|
| µg spiked |
5.4 |
9.0 |
18.09 |
36.18 |
73.36 |
180.9 |
452 |
904.5 |
1809 |
|
| µg |
2.9 |
5.1 |
11.2 |
24.9 |
51.7 |
145.5 |
386 |
785 |
1683 |
| recovered |
2.8 |
4.5 |
11.1 |
24.0 |
51.1 |
146.1 |
387 |
778 |
1670 |
|
2.6 |
4.6 |
10.8 |
24.3 |
51.5 |
145.6 |
382 |
779 |
1660 |
|
2.55 |
4.5 |
10.9 |
23.9 |
52.2 |
145.1 |
|
1680 |
|
2.55 |
5.0 |
10.9 |
24.2 |
51.6 |
|
1690 |
|
4.5 |
11.0 |
22.5 |
51.9 |
|
1700 |
|
 |
2.68 |
4.7 |
10.98 |
23.9 |
51.6 |
145.5 |
385 |
781 |
1680 |
| % |
49.6 |
52.2 |
60.6 |
66.2 |
71.3 |
80.4 |
85.2 |
86.3 |
92.8 |
|
The precision (at the 95% confidence level) of the mean percent recoveries for the two sample loadings which bracketed 75% recovery were determined as follows:
| amount spiked |
72.36 µg |
180.9 µg |
| mean recovery |
71.3% |
80.4% |
| SD |
0.512% |
0.244% |
| t(95%) for n = 6 |
2.571 |
|
| t(95%) for n = 4 |
|
3.182 |
| t(95%) × SD |
1.31 |
0.77 |
| mean recov. ±precision |
71.3 ±1.31% |
80.4 ±0.77% |
4.3. Reliable quantitation limit
This value is equal to the amount of styrene spiked on the 100-mg portion of a charcoal tube which will give 75% desorption. From Figure 4.3., this value is 134 µg. The recoveries above and below this value (72.36 µg and 180.9 µg) were 71.37 ±1.31% and 80.4 ±0.77%, respectively (Table 4.2.). It is assumed the recovery at the reliable quantitation limit is within these limits.
4.4. Precision and sensitivity
4.4.1. Precision was determined by replicate injections of analytical standards prepared at different concentrations (approximately 0.5, 1, and 2 times the TWA-PEL). The pooled coefficient of variation is 0.007.
Table 4.4.1.
Precision
|
| × PEL |
0.5× |
1× |
2× |
| µg/mL |
1809 |
4522 |
8141 |
|
| area |
1335220 |
3317867 |
6412810 |
| counts |
1352490 |
3370020 |
6520900 |
|
1343230 |
3367270 |
6558640 |
|
1340340 |
3383470 |
6568370 |
|
1343380 |
3386880 |
6542900 |
|
1343980 |
3387910 |
6580720 |
|
|
1343107 |
3368903 |
6530723 |
| SD |
5634 |
26477 |
61391 |
| CV |
0.00419 |
0.00785 |
0.0094 |
|
 = 0.007 = 0.007 |
|
|
4.4.2. Sensitivity was determined by plotting (Figure 4.4.) the data in Table 4.4.1. and the following Table 4.4.2. The sensitivity is taken as the slope of this curve, which is 788 area counts per (µg/mL).
Table 4.4.2.
Sensitivity
|
| µg/mL |
1.8 |
36.18 |
90.45 |
|
| area |
1353 |
28987 |
68207 |
| counts |
1187 |
27094 |
70230 |
|
1311 |
27323 |
69058 |
|
1099 |
27305 |
69088 |
|
1296 |
26891 |
68906 |
|
1147 |
26631 |
68636 |
|
4.5. Breakthrough
4.5.1. The first study was done at approximately twice the TWA-PEL using a flow rate of 0.2 L/min at approximately 75% relative humidity. Under these conditions, 5% breakthrough occurred after 176 min and 35.22 L, which calculates to be 30.5 mg of styrene retained by the 100-mg portion of charcoal (Figure 4.9.).
4.5.2. A second study was done at an air concentration approximately equal to the ceiling PEL. The flow rate was 1.01 L/min at approximately 75% relative humidity. Five percent breakthrough occurred after 33.4 min and 33.7 L which calculated to be 29.3 mg of styrene retained by the 100-mg portion of charcoal (Figure 4.10.).
4.6. Desorption efficiencies
4.6.1. The desorption efficiency over a range of 0.5 to 2 times the PEL was determined by injecting known amounts of styrene, either pure or in solution with CS2, onto the 100-mg portion of charcoal tubes. The 50-mg portion of charcoal in these tubes was previously removed. Several tubes at each loading level of styrene were prepared.
Table 4.6.1.
Desorption Efficiencies
|
| × PEL |
0.5× |
1× |
2× |
| µg/sample |
1809 |
4522 |
8141 |
|
| desorption |
93.0 |
91.9 |
92.2 |
| efficiency, |
92.3 |
92.2 |
92.4 |
| % |
91.8 |
92.6 |
92.3 |
|
92.9 |
92.8 |
92.6 |
|
93.4 |
91.6 |
92.4 |
|
93.9 |
92.6 |
92.1 |
|
|
92.8 |
92.2 |
93.2 |
| overall average = 92.4 |
|
4.6.2. Based on a 10-L air volume, desorption efficiencies at approximately 0.5, 1, and 2 times the TWA-PEL were very close to one another with an overall average of 92.4% (Figure 4.5. and Table 4.6.1.).
4.6.3. At lower levels of styrene loading, the desorption efficiency becomes lower (Table 4.2.1.).
4.6.4. It was apparent that at high loadings, the desorption efficiency became constant at 92.4%. To find the loading at which 92.4% desorption was obtained, the equation of the curve for Figure 4.11. was solved for "x" using Y = 92.4%. This gave a value of about 1400 µg. Therefore, if a tube contained 1400 µg and the desorption efficiency was 92.4%, the amount of styrene in solution would be about 1295 µg. A calibration method which assumed 10 L of air, 1.0 mL of desorbing solvent, and 100% desorption would give 1295 µg a value of 30.3 ppm. So, if a sample calculated with this calibration method gives a value of 30.3 ppm or greater, then a 92.4% desorption correction can be made.
4.6.5. If the calibration method (Section 4.6.4.) gives a value below 30.3 ppm, then the equation of the curve of Figure 4.12. should be used to calculate the corrected ppm value.
4.7. Storage test
Thirty-six samples were collected from a 416 mg/m3 dynamic test atmosphere of styrene. The atmosphere was at 75% relative humidity, 20°C, and 638 mm Hg. All samples were collected at about 0.2 L/min for 50 min. The first 6 samples were analyzed immediately after collection. Of the remaining 30 samples, 15 were stored at room temperature (20°C) and 15 were refrigerated (-5°C). About every third day, three samples from each group were analyzed. This storage test lasted for 15 days. (Figures 4.6., 4.7., and 4.8.)
Table 4.7.1.
Storage Tests
|
| storage time |
% recovery |
| (days) |
(refrigerated) |
|
(ambient) |
|
| 0 |
90.9 |
92.9 |
88.4 |
|
89.7 |
90.8 |
86.2 |
| 3 |
92.0 |
100.6 |
-- |
|
88.5 |
88.4 |
104.3 |
| 6 |
91.2 |
91.0 |
91.9 |
|
90.0 |
90.7 |
-- |
| 9 |
93.4 |
94.5 |
93.1 |
|
89.0 |
91.6 |
86.6 |
| 13 |
91.9 |
91.3 |
91.8 |
|
89.9 |
91.7 |
-- |
| 15 |
91.3 |
91.5 |
89.5 |
|
86.6 |
85.9 |
-- |
|
4.8. Stability towards decomposition
4.8.1. The first test was to check for stability after desorption. Three of the storage samples were analyzed on a designated day, then were allowed to sit at room temperature for three days until the next analysis of storage samples. Upon reanalysis, they were within 2% of the first reported value.
4.8.2. The next test was to see if the styrene might polymerize with MEK-peroxide and N,N-dimethylaniline present in the desorbed solution. Three charcoal tubes were spiked with styrene, left overnight, desorbed, and analyzed. Then 100 µL of a mixture containing MEK peroxide, dimethyl phthalate, and N,N-dimethylaniline was injected into each of the three vials containing the desorbed styrene. The vials sat overnight and were reanalyzed, giving results within 6% of the previous day.
4.8.3. The last attempt to induce polymerization was to collect styrene vapors on a charcoal tube in the presence of MEK peroxide vapors. This was done by injecting 2 µL of styrene through a septum into a glass tube. One end of the glass tube had a charcoal tube connected to it with a sampling pump running. In the opposite end was placed a glass wool plug that had been spiked with a few drops of a mixture containing MEK peroxide, dimethyl phthalate, and N,N-dimethylaniline. The air passing through the charcoal tube first passed through the glass wool, then by the drop of styrene. Three samples were collected in the above manner without the spiked glass wool and three were collected with the spiked glass wool present in the stream of air. After collection, these six charcoal tubes sat at room temperature for 6 days before desorption and analysis. Upon analysis, the amount of styrene in the samples collected with the spiked glass wool present in the air stream was within 2% of that found in the samples collected without the spiked glass wool present.

Figure 4.1. Detection limit for analytical method: 1 Fl injection of 1.81 µg/ml standard.

Figure 4.2. Detection limit for overall procedure.

Figure 4.3. Reliable quantitation limit for styrene.

Figure 4.4. Calibration curve for styrene.

Figure 4.5. Desorption efficiencies for styrene.
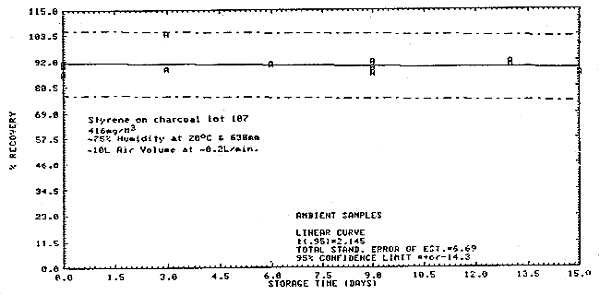
Figure 4.6. Ambient storage for styrene.

Figure 4.7. Refrigerated storage for styrene.
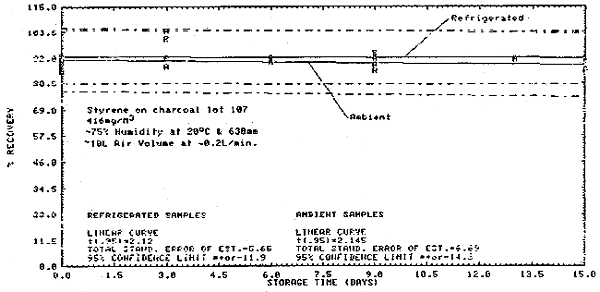
Figure 4.8. Ambient and refrigerated storage for styrene.

Figure 4.9. Breakthrough at 0.2 L/min.

Figure 4.10. Breakthrough at 1 L/min.

Figure 4.11. Desorption efficiencies for styrene.
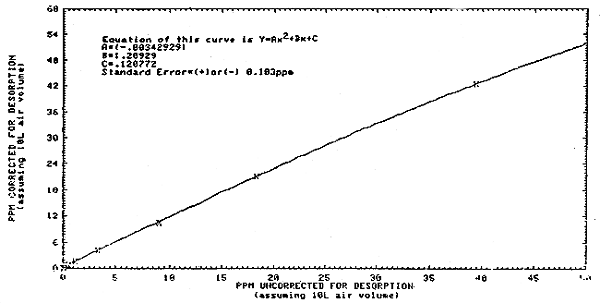
Figure 4.12. Desorption efficiencies for styrene at lower loadings.

Figure 4.13. Chromatogram of 1 µL/mL standard.
5. References
5.1. Taylor, D.C. (Manual Coordinator). "NIOSH Manual of Sampling and Analytical Methods". 2nd edition, U.S. DHEW/PHS/CDC/NIOSH, Vol. 2, 1977.
5.2. Faust, Charles L., Herman, Edward, CE, PH.D.., "Charcoal Sampling Tubes for Organic Vapor Analysis by Gas Chromatography." American Industrial Hygiene Association Journal, 27 (January, 1966), 68-74.
5.3. Houghton, J.A., Lee, George, Shobaken, Marion A., and Fox, Anne. "Practical Applications of Analysis by the Ultraviolet Absorbance Method." American Industrial Hygiene Association Journal, 25 (July, 1964), 380-385.
5.4. Ede, Lorice (Editor). "Proceedings of NIOSH styrene-butadiene Briefing". U.S. DHEW/PHS/CDC/NIOSH. Washington, D.C., Government Printing Office, 1976.
5.5. Proctor, Nick H., Ph.D. and Hughes, James P., M.D. "Chemical Hazards of the Workplace". Philadelphia: J.B. Lippincott Company, 1978.
5.6. Stecher, Paul G. (Editor) "The Merck Index". 8th edition. Rahway: Merck and Company, Inc.
5.7. "Encyclopedia of Chemical Technology", 1969, 19, 55-83.
5.8. "The Condensed Chemical Dictionary", 1977, 9th edition, 821.
|
