|
|
|
|
Drugs
and Crime Facts
| |||||||||||||||||||||||||||||||||||||||||||||||||||||||||||||||||||||||||||||||||||||||||||||||||||||||||||||||||||||||||||||||||||||||||||||||||||||||||||||||||||||||||||||||||||||||||||||||||||||||||||||||||||||||||||||||||||||||||||||||||||||||||||||||||||||||||||||||||||||||||||||||||||||||||||||||||||||||||||||||||||||||||||||||||||||||||||||||||||||||||||||||||||||||||||||||||||||||||||||||||||||||||||||||||||||||||||||||||||||||||||||||||||||||||||||||||||||||||||||||||||||||||||||||||||||||||||||||||||||||||||||||||||||||||||||||||||||||||||||||||||||||||||||||||||||||||||||||||||||||||||||||||||||||||||||||||||||||||||||||||||||||||||||||||||
| Percent of jail inmates | |||||||
|---|---|---|---|---|---|---|---|
| |
|||||||
| Most serious offense | 2002 | 1996 | 1989 | ||||
| |
|||||||
| Violent offenses | 25.4 | % | 26.3 | % | 22.5 | % | |
| Murder/a | 2.0 | 2.8 | 2.8 | ||||
| Assault | 11.7 | 11.6 | 7.2 | ||||
| Other sexual assault | 2.8 | 2.7 | 2.6 | ||||
| Property offenses | 24.4 | % | 26.9 | % | 30.0 | % | |
| Burglary | 6.7 | 7.6 | 10.7 | ||||
| Larceny/theft | 7.0 | 8.0 | 7.9 | ||||
| Drug offenses | 24.7 | % | 22.0 | % | 23.0 | % | |
| Possession | 10.8 | 11.5 | 9.7 | ||||
| Trafficking | 12.1 | 9.2 | 12.0 | ||||
| Other drug | 1.8 | 1.3 | 1.3 | ||||
| Public-order offenses | 24.9 | % | 24.3 | % | 22.8 | % | |
| Driving while intoxicated/b | 6.4 | 7.4 | 8.8 | ||||
| Drunkenness/c | 1.7 | 2.0 | 1.7 | ||||
| Note: Excludes inmates for whom offense was unknown. | |||||||
| a/Includes nonnegligent manslaughter. | |||||||
| b/Includes public and driving under the influence of drugs or alcohol. | |||||||
| c/Includes drunkenness, vagrancy, disorderly conduct, unlawful assembly, morals, and commercialized vice. | |||||||
| Source: BJS, Profile of Jail Inmates, 2002, NCJ 201932, July 2004. | |||||||
Among jail inmates who said they had been tested for HIV/AIDS and reported a result, those held for property offenses were the most likely to be HIV positive (1.8%). Drug offenders reported a slightly lower rate (1.6%). The percentage of jail inmates reporting that they were HIV positive varied by level of prior drug use.
Source: BJS, HIV in Prisons and Jails, 2002, NCJ 205333, December 2004.
| Tested jail inmates who reported results | |||||
|---|---|---|---|---|---|
| |
|||||
| Characteristics | Number | Percent HIV position | |||
| |
|||||
| Current offense/a | |||||
| Violent | 90,751 | 0.7 | % | ||
| Property | 95,599 | 1.8 | |||
| Drug | 96,003 | 1.6 | |||
| Public-order | 87,374 | 1.1 | |||
| Prior drug use/b | |||||
| Never used | 51,248 | 0.4 | % | ||
| Ever used | 322,617 | 1.5 | |||
| Used month before offense/c | 162,027 | 1.5 | |||
| Used needle to inject drugs/d | 66,606 | 3.2 | |||
| Shared a needle/e | 22,288 | 7.5 | |||
| a/Excludes jail inmates whose offense was unknown. | |||||
| b/ Inmates were asked a detailed set of questions about past use of illegal drugs. These drugs included marijuana, barbiturates, methaqualone, tranquilizers (without a doctor's prescription), methamphetamine, other amphetamines, crack, cocaine other than crack, heroin, other opiates, PCP, LSD, inhaled or sniffed substances, and other drugs. | |||||
| c/ Inmates who were unconvicted (awaiting arraignment, awaiting trial or on trial) were not asked any questions about drug use during the month before the arrest for which they were currently detained. | |||||
| d/ All inmates who reported prior drug use were asked: "Have you ever used a needle to get any drug injected under your skin, into a muscle or into a vein for non-medical reasons?" | |||||
| e/ Inmates who reported ever using a needle to inject drugs were asked: "Have you ever used a needle that you knew or suspected had been used by someone else for injecting drugs or shared a needle that you had used with someone else?" | |||||
| Source: BJS, HIV in Prisons and Jails, 2002, NCJ 205333, December 2004. | |||||
From 1995 to 2001 the number of drug offenders in state prison increased by 30,600 inmates (15%).
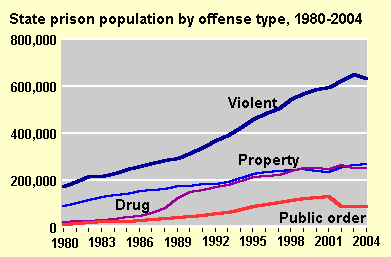 [D]
[D]
Click on the chart to view the data.
Source: BJS, Correctional Populations in the United States, annually and Prisoners in 2006
An estimated 1,274,600 sentenced prisoners were under state jurisdiction at yearend 2004. About 52% (663,700) were held for violent offenses, 20% (249,400) for drug offenses, and 21% (265,600) for property offenses.
Source: BJS, Prisoners in 2006, NCJ 219416, December 2007.
About 13% of mentally ill inmates and 22% of other inmates in state prison were incarcerated for a drug offense.
Source: BJS, Mental Health and Treatment of Inmates and Probationers, NCJ 174463, July 1999.
In 1997 parents in state prison were more likely to be serving a sentence for drug offenses (24%) than nonparents (17%). Mothers were more likely than fathers to be sentenced for drug offenses (35% compared to 23% of fathers).
In federal prison, drug offenses (67%) were the most common type of crime for which parents were serving time in 1997.
Source: BJS, Incarcerated Parents and Their Children, NCJ 182335, August 2000.
Those inmates being held on a drug offense in state prisons reported the highest HIV positive rate (2.9%).
| Number | Percent HIV positive | |||
|---|---|---|---|---|
| |
||||
| Violent | 360,370 | 1.9 | % | |
| Property | 178,601 | 2.4 | ||
| Drug | 164,256 | 2.9 | ||
| Public-order | 77,049 | 1.9 | ||
| Note: Data are from the 1996 Survey of Inmates in Local Jails and the 1997 Surveys of Inmates in State and Federal Correctional Facilities. | ||||
| Source: BJS, 1996-1997 Update: HIV/AIDS, STDs, and TB in Correctional Facilities, NCJ 176344, July 1999. | ||||
An estimated 32% of state inmates
who reported ever using a needle to inject drugs said they had a medical
problem (excluding injury) since admission to prison, compared to 25%
of those who did not use a needle.
Inmates who reported ever using a needle to inject drugs reported a higher
prevalence of physical impairments or mental conditions. Among state prisoners,
about 36% of those who used a needle and 30% of those who did not use
a needle to inject drugs reported having some physical impairments or
mental condition.
Source: BJS, Medical Problems of Inmates, 1997, NCJ 181644, January 2001.
Population by gender
Violent offenders accounted for the largest proportion of both male (53%) and female (34%) state inmates at yearend 2004.
| Male | Female | |||||
|---|---|---|---|---|---|---|
| |
||||||
| Total | 100 | % | 100 | % | ||
| Violent | 53 | 34 | ||||
| Property | 20 | 31 | ||||
| Drug | 19 | % | 29 | % | ||
| Public-order | 7 | 5 | ||||
| Other/unspecified | .5 | .9 | ||||
| Source: BJS, Prisoners in 2006, NCJ 219416, December 2007. | ||||||
Population by race
Approximately half of white, black, and Hispanic inmates under state jurisdiction were violent offenders in 2004.
| White | Black | Hispanic | |||||||||
|---|---|---|---|---|---|---|---|---|---|---|---|
| |
|||||||||||
| Total | 100 | % | 100 | % | 100 | % | |||||
| Violent | 50 | 53 | 54 | ||||||||
| Property | 26 | 18 | 18 | ||||||||
| Drug | 15 | 23 | 21 | ||||||||
| Public-order | 8 | 6 | 7 | ||||||||
| Other/unspecified | .7 | .5 | .5 | ||||||||
| Source: BJS, Prisoners in 2006, NCJ 219416, December 2007. | |||||||||||
There were 176,268 sentenced inmates under federal jurisdiction at yearend 2006. About (53%) (93,751) of federal inmates were drug offenders. An additional 27% (54,336) inmates were public-order offenders, held for offenses such as immigration and weapon violations. Between 2000 and 2006, drug offenders represented 26% of the growth in the federal inmate population; public-order offenders, 68%.
Source: BJS, Prisoners in 2006, NCJ 219416, December 2007.
In 1997, 16% of incarcerated federal drug offenders reported being an importer, grower, or manufacturer of illicit drugs; 25% reported that they distributed drugs to street-level dealers.
Source: BJS, Federal Drug Offenders, 1999 with Trends 1984-99, NCJ 187285, August 2001.
In federal prison, where the majority of inmates are incarcerated for a drug offense, 40% of those identified as mentally ill and 64% of other federal inmates were in prison for a drug-related crime.
Source: BJS, Mental Health and Treatment of Inmates and Probationers, NCJ 174463, July 1999.
In 2001, the Census of Juveniles in Residential Placement, a data collection conducted by the Office of Juveniles Justice and Delinquency (OJJDP), reported that a total of 9,086 juveniles were confined in a facility had committed a drug offense. Of this number, 5,685 juveniles were confined in a public facility and 3,390 in a private facility. The number decreased from 9,882 in 1999.
Source: OJJDP, Census of Juveniles in Residential Placement Databook, FS 200008, 2001.
As of September 30, 1994, 124 juvenile delinquents were confined in a state juvenile correctional facility under contract to the Federal Bureau of Prisons. (The Federal Bureau of Prisons does not have its own facilities for juveniles.) Most (64%) were adjudicated delinquent of a violent offense, and 14% were delinquent of a drug offense.
| Most serious offense | Number | Percent | |
|---|---|---|---|
| |
|||
| Total* | 124 | 100.0 | % |
| Violent offenses | 77 | 64.7 | |
| Property offenses | 16 | 13.4 | |
| Drug offenses | 17 | 14.3 | |
| Public-order offenses | 9 | 7.6 | |
| *Includes cases for which an offense category could not be determined. | |||
| Source: U.S. Department of Justice, Bureau of Prisons, SENTRY system data file, fiscal year ending September 30, 1994 as presented in Juvenile Delinquents in the Federal Criminal Justice System, NCJ 163066, January 1997. | |||
|
| BJS home page | Top of this page |