 U.S. Bureau of Labor Statistics
Compensation and Working Conditions Online
Older Workers and Severity of Occupational Injuries and Illnesses Involving Days Away from Work
by William J. Wiatrowski
Bureau of Labor Statistics
Originally Posted: July 26, 2005
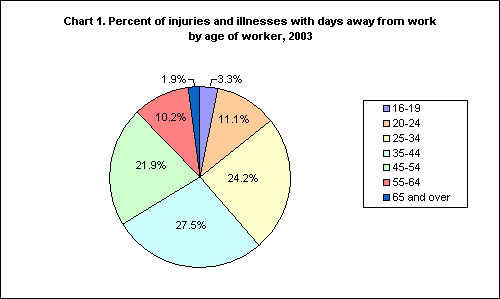
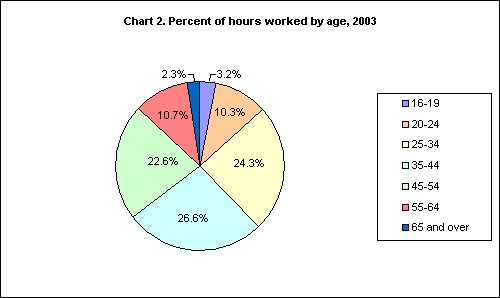

- Injuries and illnesses among those aged 65 and older made up 1.9 percent of total days-away-from-work cases in private industry in 2003, while such employees worked 2.3 percent of all hours in the same period. (Days-away-from-work cases require recuperation away from work beyond the day of the incident.) Those aged 55 to 64 accounted for 10.2 percent of days-away-from-work injuries and illnesses and 10.7 percent of hours worked. (See charts 1 and 2.)
- In contrast to their lower incidence, lost-time injuries and illnesses among those aged 65 and older tended to be more severe than those among younger workers. Injured workers aged 65 and older were away from work a median of 18 days in 2003, compared with a median of 8 days for all workers and 12 days for workers aged 55 to 64. (See chart 3.)
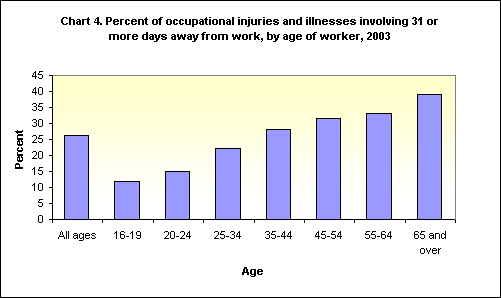
- In addition, nearly 40 percent of the days-away-from-work injuries and illnesses among those aged 65 and older involved 31 or more days off the job. The proportion of all workers with days-away-from-work injuries involving 31 or more days off was about 26 percent, and among those aged 55 to 64, it was about 33 percent. (See chart 4.)
NOTE: For more information on these data, see the news release Lost-Worktime Injuries and Illnesses: Characteristics and Resulting Days Away From Work, 2003, USDL 05-521 (U.S. Department of Labor), March 30, 2005; available on the Internet at http://www.bls.gov/iif/oshwc/osh/case/osnr0022.pdf.
Source: Bureau of Labor Statistics, Survey of Occupational Injuries and Illnesses. Hours worked data are from the Current Population Survey.
William J. Wiatrowski
Economist, Office of Safety, Health, and Working Conditions, Bureau of Labor Statistics.
Telephone: (202) 691-6305; E-mail: Wiatrowski.William@bls.gov
Data for Chart 1. Percent of injuries and illnesses with days away from work by age of worker, 2003
| Age |
Percent of injuries and illnesses |
16-19 |
3.3% |
20-24 |
11.1% |
25-34 |
24.2% |
35-44 |
27.5% |
45-54 |
21.9% |
55-64 |
10.2% |
65 and over |
1.9% |
Data for Chart 2. Percent of hours worked by age, 2003
| Age |
Percent of hours worked |
16-19 |
3.2% |
20-24 |
10.3% |
25-34 |
24.3% |
35-44 |
26.6% |
45-54 |
22.6% |
55-64 |
10.7% |
65 and over |
2.3% |
Data for Chart 3. Median days away from work due to occupational injury or illness, by age of worker, 2003
| Age |
Median days |
All ages |
8 |
14-15 |
3 |
16-19 |
4 |
20-24 |
5 |
25-34 |
6 |
35-44 |
9 |
45-54 |
11 |
55-64 |
12 |
65 and over |
18 |
Data for Chart 4. Percent of occupational injuries and illnesses involving 31 or more days away from work, by age of worker, 2003
| Age |
Percent of cases with 31 or more days |
All ages |
26.2 |
16-19 |
12 |
20-24 |
15.1 |
25-34 |
22.2 |
35-44 |
28.1 |
45-54 |
31.6 |
55-64 |
33.2 |
65 and over |
39.1 |