


Industry Facts
|
| Data Sponsored By:U.S. Census Bureau **Data Source: Econ Census/All Sectors/2002/Economy-Wide Key Statistics |
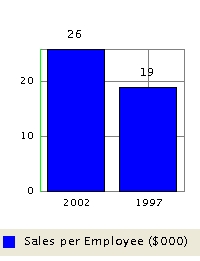
Sales per Employee
For more statistics on this industry, see the
in 2002
|
| Data Sponsored By:U.S. Census Bureau **Data Source: Econ Census/All Sectors/2002/Economy-Wide Key Statistics |
Click on map to enlarge
| |||||||||||||||||||||||||||
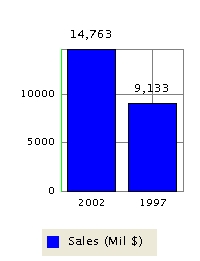
Total Sales
| |||||||||||||||