| population estimates |
| 2007 | Title Formats Available |
|---|---|
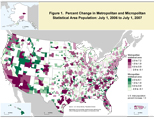 |
Percent Change in Metropolitan and Micropolitan Statistical Area Population: July 1, 2006 to July 1, 2007 |
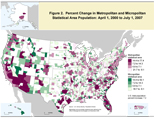 |
Percent Change in Metropolitan and Micropolitan Statistical Area Population: April 1, 2000 to July 1, 2007 |
| Download the table associated with this map [XLS (185k)] [CSV (101k)] | |
| 2007 | Title Formats Available |
|---|---|
|
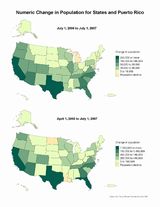
Numeric Change in Population for States and Puerto Rico: July 1, 2006 to July 1, 2007 and April 1, 2000 to July 1, 2007 |
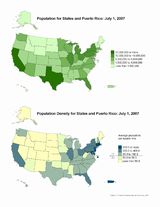 |
Population Size, Density and Distribution for States and Puerto Rico: 2007 |
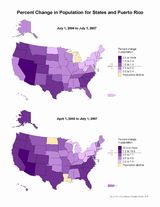 |
Percent Change in Population for States and Puerto Rico: July 1, 2006 to July 1, 2007 and April 1, 2000 to July 1, 2007 |
Download the table associated with this map [XLS (26k)] [CSV (6k)] |
|
| 2007 | Title Formats Available |
|---|---|
|
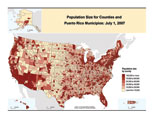
Population Size for Counties and Puerto Rico Municipios: July 1, 2007 |
|
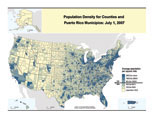
Population Density for Counties and Puerto Rico Municipios: July 1, 2007 |
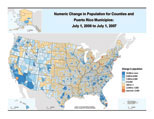 |
Numeric Change in Population for Counties and Puerto Rico Municipios: July 1, 2006 to July 1, 2007 |
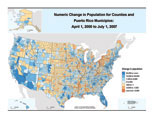 |
Numeric Change in Population for Counties and Puerto Rico Municipios: April 1, 2000 to July 1, 2007 |
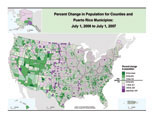 |
Percent Change in Population for Counties and Puerto Rico Municipios: July 1, 2006 to July 1, 2007 |
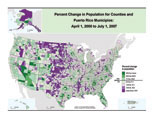 |
Percent Change in Population for Counties and Puerto Rico Municipios: April 1, 2000 to July 1, 2007 |
Download the table associated with this map [XLS (641k)] [CSV (261k)] |
|
| Source: U.S. Census Bureau, Population Division Questions? / 1-866-758-1060 |