Internet Address: http://www.bls.gov/ro2/   Transmission of material in
Media Contact: Michael L. Dolfman,(212) 337-2500    this release is embargoed
Information: Martin Kohli,(646) 264-3620            until after 8:30 A.M. (EDT)
                                                    Wednesday, April 16, 2008
NEW YORK-NORTHERN NEW JERSEY CPI UP 0.9 PERCENT IN MARCH,
3.8 PERCENT RISE FROM YEAR AGO
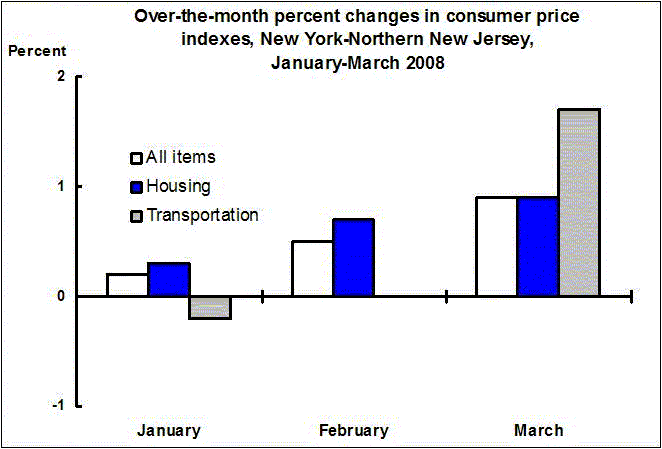
Retail prices in the greater New York area, as measured by the
Consumer Price Index for All Urban Consumers (CPI-U), rose 0.9
percent in March, the largest increase since April 2006. Michael L.
Dolfman, Regional Commissioner of the U. S. Department of Labor's
Bureau of Labor Statistics, said the March rise reflected higher
prices for housing, transportation, apparel, and food and beverages.
For the year ended in March 2008, the CPI-U rose 3.8 percent, and
core inflation, as measured by the all items less food and energy
index, was 2.6 percent.
The index for housing advanced 0.9 percent in March, after
increasing 0.7 percent in February and 0.3 percent in January. (See
chart A.) The shelter component rose 1.2 percent, primarily
reflecting an increase for out-of-town lodging. Residential rent and
owners' equivalent rent edged up 0.4 and 0.2 percent, respectively.
Among the other components of housing, the index for household
furnishings and operations was unchanged, while fuels and utilities
declined 0.5 percent. Natural gas prices dipped 0.3 percent, while
charges for electricity dropped 3.8 percent.
 New York-Northern New Jersey CPI monthly and annual percent changes
(not seasonally adjusted)
| 2003 | 2004 | 2005 | 2006 | 2007 | 2008
Month | Mo | Ann | Mo | Ann | Mo | Ann | Mo | Ann | Mo | Ann | Mo | Ann
January 0.8 3.3 0.3 2.7 0.6 4.1 0.8 3.7 0.2 2.7 0.2 3.7
February 0.8 3.3 0.6 2.5 0.4 3.9 0.2 3.6 0.6 3.1 0.5 3.6
March 0.5 3.1 1.1 3.2 1.7 4.4 0.8 2.7 0.7 2.9 0.9 3.8
April -0.2 2.6 0.3 3.7 0.0 4.2 0.9 3.6 0.5 2.5
May 0.1 2.8 0.2 3.9 -0.5 3.4 0.6 4.8 0.6 2.5
June 0.1 2.8 0.8 4.6 -0.3 2.3 0.5 5.6 0.5 2.5
July 0.4 3.0 -0.2 3.9 0.9 3.4 0.2 5.0 0.2 2.5
August 0.7 3.1 0.1 3.3 0.8 4.1 0.4 4.7 -0.1 1.9
September 0.3 3.3 0.1 3.2 0.8 4.8 -0.5 3.3 0.0 2.4
October 0.2 3.3 0.7 3.7 0.4 4.5 -0.5 2.4 0.1 3.1
November -0.3 3.1 0.0 3.9 -0.6 3.9 -0.4 2.6 0.4 3.9
December -0.1 3.2 -0.2 3.8 -0.5 3.6 0.2 3.3 0.0 3.7
The transportation index rose 1.7 percent in March, after being
unchanged in February and falling 0.2 percent in January. Gasoline
prices jumped 4.2 percent in March. The increase followed three
months of relatively smaller changes, ranging from -1.3 to 1.9
percent. The transportation index was also buoyed by higher prices
for air transportation, motor fuels other than gasoline, car and
truck rental, and other intercity transportation.
The apparel index, often up in March, increased 2.9 percent over
the month, after climbing 4.5 percent in February. Despite these
advances, the index was 1.4 percent below last year's level. Among
the apparel items recording higher March prices was jewelry.
The food and beverages index rose 0.7 percent. Grocery store
prices advanced 1.1 percent-the largest increase in 14 months. A
broad array of grocery prices advanced, including those for chicken,
bread, bananas, uncooked ground beef, and soups. Aside from
groceries, prices for food away from home edged up 0.2 percent, and
prices for alcoholic beverages increased 1.3 percent.
Among other expenditure categories, the other goods and services
index increased 0.5 percent. Education and communication, medical
care, and recreation were all unchanged over the month.
With the New York-Northern New Jersey Consumer Price Index for All
Urban Consumers at 233.122 in March (1982-84=100), $23.31 was
required to purchase what $10 could in the 1982-84 base period. The
purchasing power of the dollar was 42.9 cents in 1982-84 dollars and
14.8 cents in 1967 dollars. In March, the Consumer Price Index for
Urban Wage Earners and Clerical Workers (CPI-W) was 226.951, up 0.7
percent over the month. The CPI-W rose 3.9 percent over the year.
On a 1967 base, the March CPI-W was 646.186.
Data in this report are not seasonally adjusted. Accordingly,
month-to-month changes may reflect the impact of seasonal influences.
The New York-Northern New Jersey-Long Island, NY-NJ-CT-PA
consolidated area comprises the five boroughs of New York City,
Nassau, Suffolk, Westchester, Rockland, Putnam, Dutchess, and Orange
Counties in New York State; Bergen, Essex, Hudson, Hunterdon, Mercer,
Monmouth, Middlesex, Morris, Ocean, Passaic, Somerset, Sussex, Union
and Warren Counties in New Jersey; Fairfield County and parts of
Litchfield, New Haven and Middlesex Counties in Connecticut; and Pike
County in Pennsylvania.
NYLS - 7328 Labor - New York
04/14/08
Consumer Price Index for All Urban Consumers (CPI-U): Indexes and percent changes for selected periods
New York-Northern N.J.-Long Island, NY-NJ-CT-PA (1982-84=100 unless otherwise noted)
Indexes Percent change from-
Item and Group
Jan. Feb. Mar. Mar. Jan. Feb.
2008 2008 2008 2007 2008 2008
Expenditure category
All items........... 229.869 231.020 233.122 3.8 1.4 0.9
All items (1967=100) 664.520 667.848 673.924 - - -
Food and beverages 216.257 216.392 217.953 4.9 .8 .7
Food.............. 215.453 215.477 216.948 5.0 .7 .7
Food at home..... 214.574 213.504 215.803 5.2 .6 1.1
Food away from
home......... 222.274 223.624 224.132 4.7 .8 .2
Alcoholic
beverages..... 224.177 225.980 228.860 4.7 2.1 1.3
Housing............ 248.563 250.328 252.586 3.5 1.6 .9
Shelter........... 298.233 300.736 304.244 3.7 2.0 1.2
Rent of primary
residence 1/ 288.886 289.775 290.943 4.7 .7 .4
Owners'
equivalent
rent of
primary
residence 1/
2/ .......... 306.943 307.776 308.414 2.7 .5 .2
Fuels and
utilities..... 198.529 198.303 197.303 8.1 -.6 -.5
Household energy 200.992 200.732 199.579 8.4 -.7 -.6
Gas (piped) and
electricity
1/.......... 191.337 191.300 186.483 2.1 -2.5 -2.5
Electricity 1/ 172.635 172.351 165.808 3.7 -4.0 -3.8
Utility (piped)
gas service
1/......... 226.969 227.510 226.907 -.2 .0 -.3
Household
furnishings
and operations 127.203 127.781 127.754 -3.5 .4 .0
Apparel............ 104.895 109.602 112.728 -1.4 7.5 2.9
Transportation..... 196.532 196.627 200.012 7.7 1.8 1.7
Private
transportation 187.682 187.105 189.936 7.9 1.2 1.5
Motor fuel....... 239.795 236.792 247.212 24.2 3.1 4.4
Gasoline (all
types)...... 238.853 235.739 245.733 23.9 2.9 4.2
Gasoline,
unleaded
regular 3/ 241.606 238.519 249.334 24.0 3.2 4.5
Gasoline,
unleaded
midgrade
3/ 4/.... 239.142 235.959 244.449 24.0 2.2 3.6
Gasoline,
unleaded
premium 3/ 235.776 232.596 241.152 23.2 2.3 3.7
Medical care....... 368.031 366.619 366.596 2.5 -.4 .0
Recreation 5/...... 113.854 113.525 113.542 -.8 -.3 .0
Education and
communication
5/............ 127.531 127.671 127.688 3.4 .1 .0
Other goods and
services....... 340.952 340.327 341.966 3.0 .3 .5
Commodity and service group
All items........... 229.869 231.020 233.122 3.8 1.4 .9
Commodities........ 175.430 176.202 178.566 4.5 1.8 1.3
Commodities less
food and
beverages..... 147.054 148.095 150.731 4.2 2.5 1.8
Nondurables less
food and
beverages.... 176.863 178.595 183.522 8.0 3.8 2.8
Durables......... 107.944 108.165 108.113 -2.3 .2 .0
Services........... 276.502 277.976 279.870 3.4 1.2 0.7
Special aggregate indexes
All items less
medical care.... 223.675 224.900 227.055 3.9 1.5 1.0
All items less
shelter......... 203.135 203.711 205.228 3.9 1.0 .7
Commodities less
food............ 150.311 151.381 154.042 4.2 2.5 1.8
Nondurables......... 198.545 199.539 202.929 6.4 2.2 1.7
Nondurables less
food............ 179.987 181.729 186.564 7.7 3.7 2.7
Services less rent
of shelter 2/ 262.046 262.256 262.143 3.1 .0 .0
Services less
medical care
services........ 269.000 270.599 272.565 3.5 1.3 .7
Energy.............. 217.924 216.522 220.181 14.9 1.0 1.7
All items less
energy.......... 232.633 234.042 236.006 2.9 1.4 .8
All items less food
and energy..... 237.232 238.911 240.980 2.6 1.6 .9
1/ This index series was calculated using a Laspeyres estimator. All other item
stratum index series were calculated using a geometric means estimator.
2/ Index is on a December 1982=100 base.
3/ Special index based on a substantially smaller sample.
4/ Indexes on a December 1993=100 base.
5/ Indexes on a December 1997=100 base.
- Data not available.
New York-Northern New Jersey CPI monthly and annual percent changes
(not seasonally adjusted)
| 2003 | 2004 | 2005 | 2006 | 2007 | 2008
Month | Mo | Ann | Mo | Ann | Mo | Ann | Mo | Ann | Mo | Ann | Mo | Ann
January 0.8 3.3 0.3 2.7 0.6 4.1 0.8 3.7 0.2 2.7 0.2 3.7
February 0.8 3.3 0.6 2.5 0.4 3.9 0.2 3.6 0.6 3.1 0.5 3.6
March 0.5 3.1 1.1 3.2 1.7 4.4 0.8 2.7 0.7 2.9 0.9 3.8
April -0.2 2.6 0.3 3.7 0.0 4.2 0.9 3.6 0.5 2.5
May 0.1 2.8 0.2 3.9 -0.5 3.4 0.6 4.8 0.6 2.5
June 0.1 2.8 0.8 4.6 -0.3 2.3 0.5 5.6 0.5 2.5
July 0.4 3.0 -0.2 3.9 0.9 3.4 0.2 5.0 0.2 2.5
August 0.7 3.1 0.1 3.3 0.8 4.1 0.4 4.7 -0.1 1.9
September 0.3 3.3 0.1 3.2 0.8 4.8 -0.5 3.3 0.0 2.4
October 0.2 3.3 0.7 3.7 0.4 4.5 -0.5 2.4 0.1 3.1
November -0.3 3.1 0.0 3.9 -0.6 3.9 -0.4 2.6 0.4 3.9
December -0.1 3.2 -0.2 3.8 -0.5 3.6 0.2 3.3 0.0 3.7
The transportation index rose 1.7 percent in March, after being
unchanged in February and falling 0.2 percent in January. Gasoline
prices jumped 4.2 percent in March. The increase followed three
months of relatively smaller changes, ranging from -1.3 to 1.9
percent. The transportation index was also buoyed by higher prices
for air transportation, motor fuels other than gasoline, car and
truck rental, and other intercity transportation.
The apparel index, often up in March, increased 2.9 percent over
the month, after climbing 4.5 percent in February. Despite these
advances, the index was 1.4 percent below last year's level. Among
the apparel items recording higher March prices was jewelry.
The food and beverages index rose 0.7 percent. Grocery store
prices advanced 1.1 percent-the largest increase in 14 months. A
broad array of grocery prices advanced, including those for chicken,
bread, bananas, uncooked ground beef, and soups. Aside from
groceries, prices for food away from home edged up 0.2 percent, and
prices for alcoholic beverages increased 1.3 percent.
Among other expenditure categories, the other goods and services
index increased 0.5 percent. Education and communication, medical
care, and recreation were all unchanged over the month.
With the New York-Northern New Jersey Consumer Price Index for All
Urban Consumers at 233.122 in March (1982-84=100), $23.31 was
required to purchase what $10 could in the 1982-84 base period. The
purchasing power of the dollar was 42.9 cents in 1982-84 dollars and
14.8 cents in 1967 dollars. In March, the Consumer Price Index for
Urban Wage Earners and Clerical Workers (CPI-W) was 226.951, up 0.7
percent over the month. The CPI-W rose 3.9 percent over the year.
On a 1967 base, the March CPI-W was 646.186.
Data in this report are not seasonally adjusted. Accordingly,
month-to-month changes may reflect the impact of seasonal influences.
The New York-Northern New Jersey-Long Island, NY-NJ-CT-PA
consolidated area comprises the five boroughs of New York City,
Nassau, Suffolk, Westchester, Rockland, Putnam, Dutchess, and Orange
Counties in New York State; Bergen, Essex, Hudson, Hunterdon, Mercer,
Monmouth, Middlesex, Morris, Ocean, Passaic, Somerset, Sussex, Union
and Warren Counties in New Jersey; Fairfield County and parts of
Litchfield, New Haven and Middlesex Counties in Connecticut; and Pike
County in Pennsylvania.
NYLS - 7328 Labor - New York
04/14/08
Consumer Price Index for All Urban Consumers (CPI-U): Indexes and percent changes for selected periods
New York-Northern N.J.-Long Island, NY-NJ-CT-PA (1982-84=100 unless otherwise noted)
Indexes Percent change from-
Item and Group
Jan. Feb. Mar. Mar. Jan. Feb.
2008 2008 2008 2007 2008 2008
Expenditure category
All items........... 229.869 231.020 233.122 3.8 1.4 0.9
All items (1967=100) 664.520 667.848 673.924 - - -
Food and beverages 216.257 216.392 217.953 4.9 .8 .7
Food.............. 215.453 215.477 216.948 5.0 .7 .7
Food at home..... 214.574 213.504 215.803 5.2 .6 1.1
Food away from
home......... 222.274 223.624 224.132 4.7 .8 .2
Alcoholic
beverages..... 224.177 225.980 228.860 4.7 2.1 1.3
Housing............ 248.563 250.328 252.586 3.5 1.6 .9
Shelter........... 298.233 300.736 304.244 3.7 2.0 1.2
Rent of primary
residence 1/ 288.886 289.775 290.943 4.7 .7 .4
Owners'
equivalent
rent of
primary
residence 1/
2/ .......... 306.943 307.776 308.414 2.7 .5 .2
Fuels and
utilities..... 198.529 198.303 197.303 8.1 -.6 -.5
Household energy 200.992 200.732 199.579 8.4 -.7 -.6
Gas (piped) and
electricity
1/.......... 191.337 191.300 186.483 2.1 -2.5 -2.5
Electricity 1/ 172.635 172.351 165.808 3.7 -4.0 -3.8
Utility (piped)
gas service
1/......... 226.969 227.510 226.907 -.2 .0 -.3
Household
furnishings
and operations 127.203 127.781 127.754 -3.5 .4 .0
Apparel............ 104.895 109.602 112.728 -1.4 7.5 2.9
Transportation..... 196.532 196.627 200.012 7.7 1.8 1.7
Private
transportation 187.682 187.105 189.936 7.9 1.2 1.5
Motor fuel....... 239.795 236.792 247.212 24.2 3.1 4.4
Gasoline (all
types)...... 238.853 235.739 245.733 23.9 2.9 4.2
Gasoline,
unleaded
regular 3/ 241.606 238.519 249.334 24.0 3.2 4.5
Gasoline,
unleaded
midgrade
3/ 4/.... 239.142 235.959 244.449 24.0 2.2 3.6
Gasoline,
unleaded
premium 3/ 235.776 232.596 241.152 23.2 2.3 3.7
Medical care....... 368.031 366.619 366.596 2.5 -.4 .0
Recreation 5/...... 113.854 113.525 113.542 -.8 -.3 .0
Education and
communication
5/............ 127.531 127.671 127.688 3.4 .1 .0
Other goods and
services....... 340.952 340.327 341.966 3.0 .3 .5
Commodity and service group
All items........... 229.869 231.020 233.122 3.8 1.4 .9
Commodities........ 175.430 176.202 178.566 4.5 1.8 1.3
Commodities less
food and
beverages..... 147.054 148.095 150.731 4.2 2.5 1.8
Nondurables less
food and
beverages.... 176.863 178.595 183.522 8.0 3.8 2.8
Durables......... 107.944 108.165 108.113 -2.3 .2 .0
Services........... 276.502 277.976 279.870 3.4 1.2 0.7
Special aggregate indexes
All items less
medical care.... 223.675 224.900 227.055 3.9 1.5 1.0
All items less
shelter......... 203.135 203.711 205.228 3.9 1.0 .7
Commodities less
food............ 150.311 151.381 154.042 4.2 2.5 1.8
Nondurables......... 198.545 199.539 202.929 6.4 2.2 1.7
Nondurables less
food............ 179.987 181.729 186.564 7.7 3.7 2.7
Services less rent
of shelter 2/ 262.046 262.256 262.143 3.1 .0 .0
Services less
medical care
services........ 269.000 270.599 272.565 3.5 1.3 .7
Energy.............. 217.924 216.522 220.181 14.9 1.0 1.7
All items less
energy.......... 232.633 234.042 236.006 2.9 1.4 .8
All items less food
and energy..... 237.232 238.911 240.980 2.6 1.6 .9
1/ This index series was calculated using a Laspeyres estimator. All other item
stratum index series were calculated using a geometric means estimator.
2/ Index is on a December 1982=100 base.
3/ Special index based on a substantially smaller sample.
4/ Indexes on a December 1993=100 base.
5/ Indexes on a December 1997=100 base.
- Data not available.
Last Modified Date: May 14, 2008
Quick Links
Tools
|
Calculators
|
Help
|
Info
|
|


