|
|
Fly-by Movies of Ancient Landslides in the East Bay Hills and in Marin County
 FLY-BY OF CROSS-SECTIONAL VIEW FLY-BY OF CROSS-SECTIONAL VIEW
OF A LANDSLIDE |
|
QUICKTIME MOVIE
 7.8 MB 7.8 MB
|
MPEG MOVIE
 2.5 MB 2.5 MB
|
ANIMATED GIF
 6.9 MB 6.9 MB
|
|
EAST BAY HILLS FLY-BY
mpeg movie, 1.7 MB
Fly-by showing landslides (in red) throughout the East Bay Hills from Fremont to Oakland. The image includes Sunol and Livermore Valleys in the background. The fly-by ends with a close-up view looking down directly on the Snake Road.
|
MARIN COUNTY FLY-BY
mpeg movie, 2.2 MB
Fly-by showing landslides (in red) in Marin County. The flight starts down the Tomales Bay, following the path of the San Andreas fault, continues southward along Stinson Beach, crosses eastward the Marin Headlands, and swings northward to the city of Novato.
|
Examples of Landslides and Debris Flows
1996-97 Rainy Season
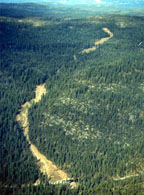
DEBRIS FLOW
SIERRA NEVADA
(computer simulation) |
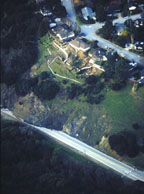
DEEP-SEATED LANDSLIDE
POLHEMUS ROAD,
SAN MATEO COUNTY
(computer simulation) |

+ more photos! |
anim. gif 2.0 MB
|
mpeg movie
3.6 MB
|
|
|
larger photo 47kb jpg
|
anim. gif 2.2 MB
|
mpeg movie
1.9 MB
|
|
| To see a larger jpeg image, click on the jpeg image icon. To see an animation of either event, choose either an animated gif (which should display within your web browser) or an mpeg movie (for which you will need an mpeg player such as "Sparkle"). |
| This computer simulation depicts the Sourgrass debris flow (Sierra Nevada, North Fork of the Stanislaus River), of January 1, 1997. The flow was 2.4 miles long, with a vertical drop of 2,000 feet. The first half moved 2 to 3 miles per hour, which is roughly the speed of a fast walk. The second half accelerated to 12 miles per hour, or the speed of a runner doing a 5 minute mile. |
This computer simulation depicts the movement of a deep-seated "slump" type landslide in San Mateo County. Beginning a few days after the 1997 New Year's storm, the slump opened a large fissure on the uphill scarp and created a bulge at the downhill toe. As movement continued at an average rate of a few feet per day, the uphill side dropped further, broke through a retaining wall, and created a deep depression. At the same time the toe slipped out across the road. Over 250,000 tons of rock and soil moved in this landslide. |
|