Time-lapse animation of Jupiter's moon Io in eclipse
Type: Animated GIF
As the Cassini spacecraft passed through the Jovian
system on its way to Saturn, it captured more than 500
images of Io during the eclipse of January 2001 where Io passed
through Jupiter's shadow.
Glowing aurorae can be seen around the edge of the disk,
bright points indicate hot lava,
and the prominent glow in the lower right portion of the disk
is the volcano Pele.
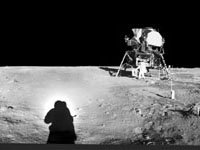
This panorama was collected by Neil Armstrong from a spot east of the landing module while
Buzz Aldrin was unloading the science packages.
The object with the handle between Neil and the lander is the Gold Camera, which was used
to take close-up photos of the very top layer of the lunar soil.
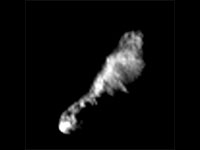
The Deep Space 1 (DS-1) spacecraft flew by the comet Borrelly on September 22, 2001,
providing the highest resolution imagery ever collected of a comet to date.
MICAS Images with phase angles ranging from approximately 80° to 50° were
used to produce this animated movie.
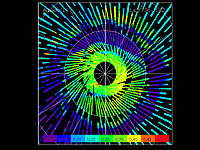
The animation is composed of two composite albedo images of the martian
north polar cap from the martian mid-summer in 1999 (May 9-21) and 2001
(March 27 - April 7). The color scheme represents albedo
(surface brightness) where red is the brightest and purple is the darkest.
Regions with albedo less than .23 are soil (purple-blue). Regions
brighter than 0.23 are covered with water ice. The brightest regions
(red) are covered with frost from condensing water in the atmosphere.
The animation shows interannual variations in the cap brightness,
suggesting a variation in frost formation from year to year.
A greater understanding of the processes that cause summer frost formation
on the northern cap will help NASA and the scientific community discover
how water on Mars is transported.
555 x 555, 147 kB
For information, images, and more animations:
Mars Global Surveyor: Thermal Emission Spectrometer
![[USGS Banner]](https://webarchive.library.unt.edu/eot2008/20081107075814im_/http://astrogeology.usgs.gov/assets/banners/default.jpg)
![[Click to view animation - Animated of eclipse C in color]](https://webarchive.library.unt.edu/eot2008/20081107075814im_/http://astrogeology.usgs.gov/Projects/IoAurorae/eclipse_C_str_l_thumb.gif)