All Images

Press Release 08-164
All Students Proficient on State Tests by 2014?

Analysis of California elementary school achievement data shows projected improvements in student performance will fall short of legislated benchmarks
Back to article | Note about images
 |
One of the challenges of meeting adequate yearly progress (AYP) under No Child Left Behind is that schools, districts and states must report not only a rise in total scores, but also progress in the scores of subgroups of students, including minority students, English language learners (ELL) and students with disabilities.
Credit: © 2008 JupiterImages Corporation |
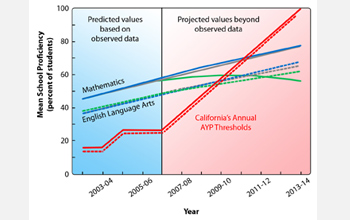 |
Researchers at the University of California, Riverside (UCR) used state assessment data reported for the school years 2002-2003 through 2006-2007 to project the growth in student proficiency through 2014. Data was drawn from more than 4,900 California elementary schools. The researchers used three different growth models (represented by the blue, grey and green lines) to project average annual growth in proficiency for mathematics (solid lines) and English language arts (dotted lines). Models are plotted out to 2014 to illustrate that the available data (through 2007) does not indicate the accelerated growth in proficiency required to meet legislated goals. California's benchmarks for adequate yearly progress (AYP) under No Child Left Behind are shown in the red lines. More information on this research appears in the Sept. 26, 2008, edition of Science magazine.
Credit: University of California, Riverside |
Download the high-resolution JPG version of the image. (488 KB)
|
Use your mouse to right-click (or Ctrl-click on a Mac) the link above and choose the option that will save the file or target to your computer.
|
 |
The researchers' findings are published in the Sept. 26, 2008, issue of Science magazine.
Credit: Copyright AAAS 2008 |
Download the high-resolution JPG version of the image. (1.1 MB)
|
Use your mouse to right-click (or Ctrl-click on a Mac) the link above and choose the option that will save the file or target to your computer.
|
|