USGS/Cascades Volcano Observatory, Vancouver, Washington
Mount St. Helens, Washington
"A General Slide Set"
by Lyn Topinka, USGS/CVO/WRD
- One of our most popular web features ... 50 images with captions ... covering
pre-eruption ... May 18, 1980 ... aftermath ... monitoring ... dome growth ...
drainage channel erosion ... volcanic hazards ... and MORE ...
- click on thumbnail for "user-friendly" medium-size image ...
- medium-size images are around 100 K and best for web viewing ...
- large-size images are 3-4 M, scanned images, no logo, 300 dpi, 8x10 to 9x12 size, and good for printing and publication ...
-
GS-1
 [Image,16K,GIF]
The Cascade Range is a volcanic chain stretching from northern California
to British Columbia
-
GS-2
-
MSH80_st_helens_before_big_eruption_04-10-80.jpg
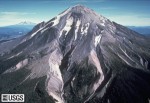
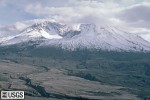
The smallest of five major volcanic peaks in Washington State was Mount St. Helens, with an elevation of 9,677 feet (2,950 meters) before the eruption of May 18, 1980. Another Cascade volcano, Mount Adams (12,286 feet [3,745 meters]), is in the distance. The view is from the west.
USGS Photograph taken on April 10, 1980, by Donald A. Swanson.
[medium size] ...
[large size]
-
GS-3
-
-
MSH80_phreatic_eruption_st_helens_spring_1980.jpg
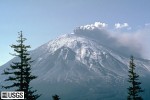
Small phreatic eruption of Mount St. Helens in the spring of 1980, before the May 18, 1980 blast.
USGS Photograph taken by the Cascades Volcano Observatory.
[medium size] ...
[large size]
-
GS-4
-
-
MSH80_bulge_on_north_side_04-27-80.jpg
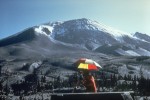
A "bulge" developed on the north side of Mount St. Helens as magma pushed up within the peak. Angle and slope-distance measurements to the bulge indicated it was growing at a rate of up to five feet (1.5 meters) per day. By May 17, part of the volcano's north side had been pushed upwards and outwards over 450 feet (135 meters). The view is from the northeast.
USGS Photograph taken on April 27, 1980, by Peter Lipman.
[medium size] ...
[large size]
-
GS-5
-
-
MSH80_eruption_mount_st_helens_05-18-80.jpg
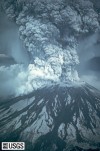
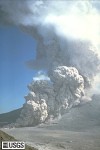
On May 18, 1980, at 8:32 a.m. Pacific Daylight Time, a magnitude 5.1 earthquake shook Mount St. Helens. The bulge and surrounding area slid away in a gigantic rockslide and debris avalanche, releasing pressure, and triggering a major pumice and ash eruption of the volcano. Thirteen-hundred feet (400 meters) of the peak collapsed or blew outwards. As a result, 24 square miles (62 square kilometers) of valley was filled by a debris avalanche, 250 square miles (650 square kilometers) of recreation, timber, and private lands were damaged by a lateral blast, and an estimated 200 million cubic yards (150 million cubic meters) of material was deposited directly by lahars (volcanic mudflows) into the river channels. Fifty-seven people were killed or are still missing.
USGS Photograph taken on May 18, 1980, by Austin Post.
[medium size] ...
[large size] ...
[TIF Format, 40 M] ...
-
GS-6
-
-
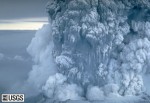
MSH80_eruption_mount_st_helens_plume_05-18-80.jpg
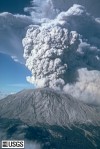
For more than nine hours a vigorous plume of ash erupted, eventually reaching 12 to 15 miles (20-25 kilometers) above sea level. The plume moved eastward at an average speed of 60 miles per hour (95 kilometers/hour), with ash reaching Idaho by noon. By early May 19, the devastating eruption was over. Shown here is a close-up view of the May 18 ash plume.
USGS Photograph taken on May 18, 1980, by Donald A. Swanson.
[medium size] ...
[large size] ...
[TIF Format, 18 M] ...
-
GS-7
 [Image,21K,GIF]
Map of the area around Mount St. Helens which were affected by the May 18,
1980 eruption. North is to the top.
-
GS-8
-

-
MSH80_st_helens_debris_avalanche_helicopter_09-16-80.jpg
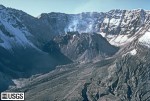
After the May 18, 1980 eruption, Mount St. Helens' elevation was only 8,364 feet (2,550 meters) and the volcano had a one-mile-wide (1.5 kilometers) horseshoe-shaped crater. View here is from the northwest.
USGS Photograph taken on September 16, 1980, by Tom Casadevall.
[medium size] ...
[large size]
-
GS-9
-
-
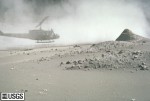
MSH80_volcanic_ash_with_helicopter_08-22-80.jpg
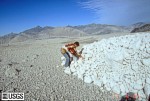
For weeks volcanic ash covered the landscape around the volcano and for several hundred miles downwind to the east. Noticeable ash fell in eleven states. The total volume of ash (before its compaction by rainfall) was approximately 0.26 cubic mile (1.01 cubic kilometers), or, enough ash to cover a football field to a depth of 150 miles (240 kilometers). In this photograph, a helicopter stirs up ash while trying to land in the devastated area.
USGS Photograph taken on August 22, 1980, by Lyn Topinka.
[medium size] ...
[large size]
-
GS-10
-
-
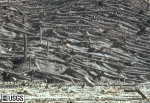
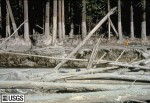
MSH80_blowdown_smith_creek_09-24-80.jpg
The slopes of Smith Creek valley, east of Mount St. Helens, show trees blown down by the May 18, 1980 lateral blast. Two U.S. Geological Survey scientists (lower right) give scale. The direction of the blast, shown here from left to right, is apparent in the alignment of the downed trees. Over four billion board feet of usable timber, enough to build 150,000 homes, was damaged or destroyed.
USGS Photograph taken on September 24, 1980, by Lyn Topinka.
[medium size] ...
[large size]
-
GS-11
-
-
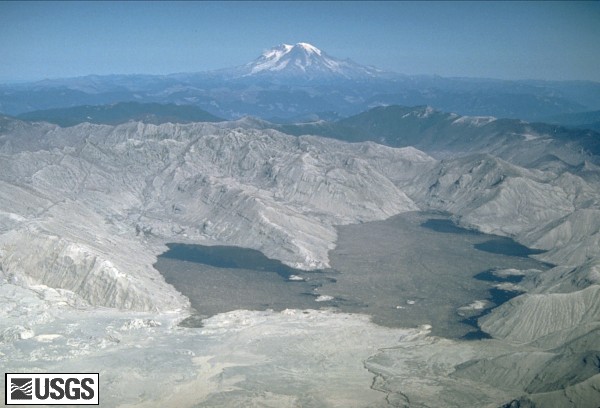
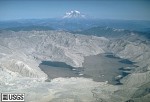
MSH80_blast_area_spirit_lake_with_rainier_10-04-80.jpg
Spirit Lake, once surrounded by lush forest, is within the area devastated by blast. Remnants of the forest float on the surface of the lake. Another Cascade volcano, Mount Rainier (14,410 feet [4,392 meters]), is in the distance. The view is from the south.
USGS Photograph taken on October 4, 1980, by Lyn Topinka.
[medium size] ...
[large size]
-
GS-12
-
-
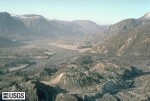
MSH83_debris_avalanche_north_fork_toutle_11-30-83.jpg
Downstream view of the North Fork Toutle River valley, north and west of St. Helens, shows part of the nearly 2/3 cubic miles (2.3 cubic kilometers) of debris avalanche that slid from the volcano on May 18, 1980. This is enough material to cover Washington, D.C. to a depth of 14 feet (4 meters). The avalanche traveled approximately 15 miles (24 kilometers) downstream at a velocity exceeding 150 miles per hour (240 km/hr). It left behind a hummocky deposit with an average thickness of 150 feet (45 meters) and a maximum thicknes of 600 feet (180 meters).
USGS Photograph taken on November 30, 1983, by Lyn Topinka.
[medium size] ...
[large size]
-
GS-13
-
-
MSH80_mudline_muddy_river_with_USGS_scientist_10-23-80.jpg
Nearly 135 miles (220 kilometers) of river channels surrounding the volcano were affected by the lahars of May 18, 1980. A mudline left behind on trees shows depths reached by the mud. A scientist (middle right) gives scale. This view is along the Muddy River, southeast of Mount St. Helens.
USGS Photograph taken on October 23, 1980, by Lyn Topinka.
[medium size] ...
[large size]
-
GS-14
-
-
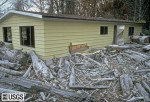
MSH81_damaged_home_south_fork_toutle_river_07-19-81.jpg
More than 200 homes and over 185 miles (300 kilometers) of roads were destroyed by the 1980 lahars. Pictured here is a damaged home along the South Fork Toutle River.
USGS Photograph taken on July 19, 1981, by Lyn Topinka.
[medium size] ...
[large size]
-
GS-15
-
-
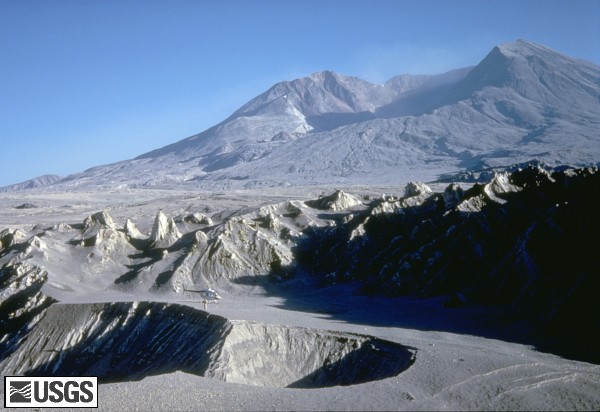
MSH80_pyroclastic_flow_from_st_helens_crater_08-07-80.jpg
During the May 18, 1980 eruption, at least 17 separate pyroclastic flows descended the flanks of Mount St. Helens. Pyroclastic flows typically move at speeds of over 60 miles per hour (100 kilometers/hour) and reach temperatures of over 800 Degrees Fahrenheit (400 degrees Celsius). Photographed here, a pyroclastic flow from the August 7, 1980 eruption stretches from Mount St. Helens' crater to the valley floor below.
USGS Photograph taken on August 7, 1980, by Peter W. Lipman.
[medium size] ...
[large size]
-
GS-16
-
-
MSH80_USGS_scientist_toe_pyroclastic_flow_10-17-80.jpg
U.S. Geological Survey scientist examines pumice blocks at the toe of a pyroclastic flow.
USGS Photograph taken on October 17, 1980, by Terry Leighley, Scandia Labs.
[medium size] ...
[large size]
-
GS-17
-
-
MSH80_st_helens_eruption_plume_07-22-80.jpg
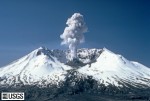
Five more explosive eruptions of Mount St. Helens occurred in 1980 (after May 18), including this spectacular event of July 22. This eruption sent pumice and ash 6 to 11 miles (10-18 kilometers) into the air, and was visible in Seattle, Washington, 100 miles (160 kilometers) to the north. The view here is from the south.
USGS Photograph taken on July 22, 1980, by Mike Doukas.
[medium size] ...
[large size]
-
GS-18
-
-
MSH82_lahar_from_march_82_eruption_03-21-82.jpg
Mount St. Helens erupted often between 1980 and 1986. An explosive eruption on March 19, 1982, sent pumice and ash 9 miles (14 kilometers) into the air, and resulted in a lahar (the dark deposit on the snow) flowing from the crater into the North Fork Toutle River valley. Part of the lahar entered Spirit Lake (lower left corner) but most of the flow went west down the Toutle River, eventually reaching the Cowlitz River, 50 miles (80 kilometers) downstream.
USGS Photograph taken on March 21, 1982, by Tom Casadevall.
[medium size] ...
[large size]
-
GS-19
-
-
MSH82_st_helens_plume_from_harrys_ridge_05-19-82.jpg
Plumes of steam, gas, and ash often occured at Mount St. Helens in the early 1980s. On clear days they could be seen from Portland, Oregon, 50 miles (81 kilometers) to the south. The plume photographed here rose nearly 3,000 feet (1,000 meters) above the volcano's rim. The view is from Harrys Ridge, five miles (8 kilometers) north of the mountain.
USGS Photograph taken on May 19, 1982, by Lyn Topinka.
[medium size] ...
[large size] ...
[TIF Format, 20 M] ...
-
GS-20
-
-
MSH84_st_helens_crater_dome_from_NNW_09-13-84.jpg
Since December 1980, eruptions of Mount St. Helens have added material to a dacitic lava dome with the crater, as seen here in this 1984 view from the north-northwest.
USGS Photograph taken on September 13, 1984, by Lyn Topinka.
[medium size] ...
[large size]
-
GS-21
-
-
MSH80_october_dome_10-24-80.jpg
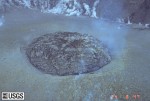
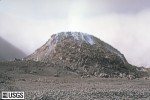
A new dome started growing on October 18,1980. This October dome was 112 feet (34 meters) high and 985 feet (300 meters) wide, making it taller than a nine-story building and wider than the length of three football fields. This aerial view is from the north.
This dome was not the first dome to grow in the crater. In June and August 1980, two domes formed, ony to be blasted away by the explosive events of July 22 and October 16.
USGS Photograph taken on October 24, 1980, by Terry Leighley, Scandia Labs.
[medium size] ...
[large size] ...
[large size in black/white]
-
GS-22
-
-
MSH81_new_lobe_spreading_center_from_west_06-26-81.jpg
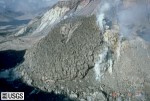
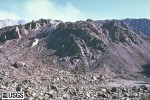
Betweem 1980 and 1986, Mount St. Helens' dome grew in different ways. From 1980 through 1982 the dome grew in periodic extrusions of stubby lava flows, called lobes. This pattern changed in February 1983, when growth became continuous and mostly endogenous (internal). Perioidic lobe growth, along with endogenous growth, resumed in early 1984. Pictured here is an aerial view of Mount St. Helens' dome and the June 1981 lobe with its "spreading center". A spreading center is the area from which new lava slowly emerges during lobe growth. During this time frame Mount St. Helens' lobes grew at a rate of 3 to 10 feet per hour (1-3 meters/hour).
USGS Photograph taken on June 26, 1981, by Dan Dzurisin.
[medium size] ...
[large size]
-
GS-23
-
-
MSH81_st_helens_dome_from_deepthroat_08-22-81.jpg
Mount St. Helens' lava dome in August 1981, as viewed from a photo station "Deepthroat", 1/2 mile (0.8 kilometers) away. In this view the dome is 535 feet (163 meters) high and nearly 1/4 mile (0.4 kilometers) wide, making it taller than a 44-story building (or, nearly the height of the Washington Monument) and wider than the length of four football fields. Compare with image taken August 12, 1985 from the same location with the same camera.
USGS Photograph taken on August 22, 1981, by Lyn Topinka.
[medium size] ...
[large size]
-
GS-24
-
-
MSH85_st_helens_dome_from_deepthroat_08-12-85.jpg
Mount St. Helens' lava dome as viewed from the "Deepthroat" station after five years of growth. The lava dome was 755 feet (230 meters) high and 1/2 mile (0.8 kilometers) wide in this view, making it taller than a 66-story building and almost as wide as the length of nine football fields. The dome completely fills the camera's field of view. Compare with image taken August 22, 1981 from the same location with the same camera.
USGS Photograph taken on August 12, 1985, by Lyn Topinka.
[medium size] ...
[large size]
-
GS-25
-
-
MSH83_USGS_scientists_on_south_side_of_dome_05-26-83.jpg
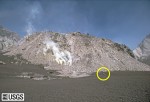
Two U.S. Geological Survey geologists (one in orange, middle right, near base of dome) are dwarfed by the dome. The geologists stand on snow muddied from recent ashfall. By 1987, the dome had replaced only three percent of the volume removed by the May 18, 1980 eruption. If that rate of growth had continued it would have taken over 200 years to rebuild Mount St. Helens to its pre-1980 size. Instead, Mount St. Helens entered a quiet period which continued until 2004.
USGS Photograph taken on May 26, 1983, by Lyn Topinka.
[medium size] ...
[large size]
-
GS-26
-
-
MSH86_st_helens_night_shot_new_lobe_10-22-86.jpg
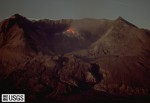
The last dome-building eruption of Mount St. Helens during the 1980s occurred in October 1986. A new lobe was extruded, increasing the dome's height to 925 feet (282 meters), making it taller than a 77-story building. In volume, the dome was nearly 40 times the size of Seattle's Kingdome stadium. In this 30-minute, moon-lit exposure, hot rock from the new lobe is seen glowing on top of the dome. The view is from Harrys Ridge, five miles (8 kilometers) north of the volcano.
USGS Photograph taken on October 22, 1986, by Lyn Topinka.
[medium size] ...
[large size]
-
GS-27
-
-
MSH81_USGS_scientists_measure_radial_crack_base_dome_05-12-81.jpg
The U.S. Geological Survey established both periodic and continuous 24-hour
monitoring programs at Mount St. Helens to study and predict eruptions. In this
slide, geologists used a steel tape to measure the distance across a crack on the
crater floor. Widening of cracks was an indication that magma was rising and
deforming the area, leading to an eruption. These cracks were generally
radial to the dome, like spokes of a wheel.
USGS Photograph taken on May 12, 1981, by Lyn Topinka.
[medium size] ...
[large size]
-
GS-28
-
-
MSH84_USGS_scientists_survey_the_dome_05-26-84.jpg
U.S. Geological Survey geologists use a theodolite and EDM (Electronic Distance Meter) to measure angles and slope-distances to the lava dome. Changes in these angles and distances are used to calculate "deformation rates". An increase in deformation rates is an indication that magma is slowly entering the dome. In the early 1980s deformation rates often reached 30 feet per hour (10 meters/hour) as magma rose and the dome expanded before extrusion started. During the winter months, the instrument stations often had to be dug out of the snow before measurements could be made.
USGS Photograph taken on May 26, 1984, by Lyn Topinka.
[medium size] ...
[large size]
-
GS-29
-
-
MSH81_installing_seismic_station_base_dome_08-04-81.jpg
Geologists install a seismic station near the dome. The U.S. Geological Survey, in conjunction with the University of Washington, maintained seismic stations at Mount St. Helens. An increase in seismicity (earthquakes) was often the first precursor to an approaching eruption.
USGS Photograph taken on August 4, 1981, by Gene Iwatsubo.
[medium size] ...
[large size]
-
GS-30
-
-
MSH81_collecting_gas_samples_base_dome_09-24-81.jpg
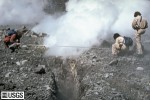
USGS geologists collect gas samples around the dome. Samples were gathered from vents on the dome and crater floor, and were used to monitor changes in chemical composition. Additionally, sulfur dioxide gas was measured from a specially-equipped airplane before, during, and after eruptions to determine "emission rates" for the volcano. During eruptions, emission rates typically increased to 5 to 10 times their pre-eruptive value.
USGS Photograph taken on September 24, 1981, by Thomas J. Casadevall.
[medium size] ...
[large size]
-
GS-31
-
-
MSH84_measuring_magnetic_field_in_crater_06-18-84.jpg
Geologists measured the strength of the magnetic field surrounding the dome. The strength of the field increased as the dome cooled and magnetic minerals formed. During the eruptions the strength usually changed rapidly as magma heated and deformed the dome.
USGS Photograph taken on June 18, 1984, by Lyn Topinka.
[medium size] ...
[large size]
-
GS-32
-
-
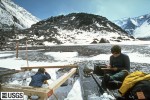
MSH82_leveling_slope_changes_crater_floor_05-82.jpg
Geologists did precise leveling to measure changes in the slope of the crater floor, due to moving magma. Changes in slope was also measured electronically by tiltmeters. Tiltmeters allowed 24-hour monitoring as the information was telemetered back to CVO. Other instruments such as displacement meters for measuring cracks, seismometers for measuring earthquakes, gas sensors for measuring gas concentrations, and magnetometers for measuring the magnetic field, were also used for 24-hour monitoring. Spirit Lake is visible in the background in this image.
USGS Photograph taken in May 1982, by Holly Martinson.
[medium size] ...
[large size]
-
GS-33
-
-
MSH88_deformation_monitoring_top_dome_04-18-88.jpg
In 1983, the U.S. Geological Survey extended both its periodic and its 24-hour monitoring programs to the top of Mount St. Helens' dome. In this aerial view, three geologists (middle bottom) were busy taking measurements to determine deformation rates
USGS Photograph taken in April 18, 1988, by Lyn Topinka.
[medium size] ...
[large size]
-
GS-34
-
-
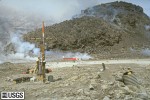
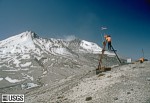
MSH89_outerflanks_monitoring_station_05-15-89.jpg
In addition to monitoring stations within Mount St. Helens' crater, the U.S. Geological Survey also maintained a network of monitoring stations around the base of the volcano. Angle and distance measurements to the volcano's flanks were taken periodically to watch for any deformation similar to the 1980 bulge. Pictured here is an instrument station northeast of the volcano.
USGS Photograph taken in May 15, 1989, by Lyn Topinka.
[medium size] ...
[large size]
-
GS-35
-
-
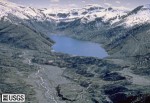
MSH84_castle_lake_debris_avalanche_march_1984.jpg
The May 18, 1980 debris avalanche from Mount St. Helens covered over 24 square miles (62 square kilometers) of the upper Toutle River valley and blocked tributaries of the North Fork Toutle River. New lakes such as Castle Lake (pictured here) and Coldwater Lake were created.
USGS Photograph taken in March 1984 by Robert L. Schuster.
[medium size] ...
[large size]
-
GS-36
-
-
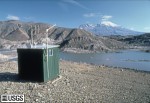
MSH82_coldwater_lake_early_warning_gage_10-01-82.jpg
One major concern to people living downstream of Mount St. Helens was a breakout of any of the impounded lakes, such as Coldwater or Castle Lakes, due to the instability of the debris dams blocking them. Flood waters from a breakout could be more catastrophic than the lahars of May 18, 1980. Gages, such as this Early Warning Gage on Coldwater Lake, were installed at lakes and streams surrounding the volcano. These gages continuously monitored changes in water levels. Major increases or decreases in levels trigger warnings which are telemetered to the U.S. Geological Survey's Cascades Volcano Observatory in Vancouver.
USGS Photograph taken on October 1, 1982, by Lyn Topinka.
[medium size] ...
[large size]
-
GS-37
-
-
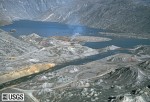
MSH81_coldwater_lake_outlet_channel_10-17-81.jpg
Outlet channels were built at Castle Lake and Coldwater Lake (shown here) to stabilize water levels and prevent overtopping of the debris dams.
USGS Photograph taken in October 17, 1981, by Lyn Topinka.
[medium size] ...
[large size]
-
GS-38
-

-
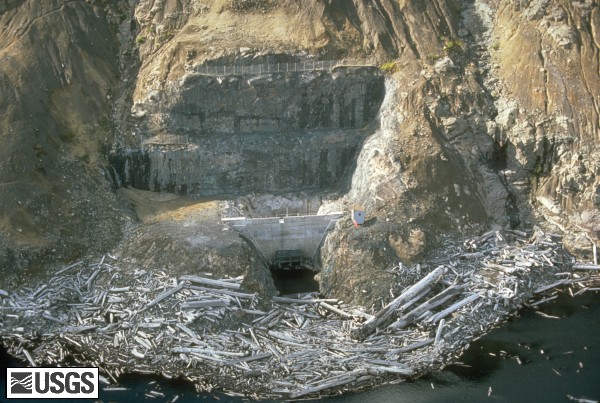
MSH86_spirit_lake_tunnel_10-02-86.jpg
In the spring of 1985 a permanent tunnel was opened, allowing water to drain out of the Spirit Lake safely. This tunnel is 11 feet (3.4 meters) in diameter and more than 1.5 miles (2.5 kilometers) in length. The water level of Spirit Lake is now maintained at approximately 100 feet (30 meters) below the estimated overtopping level.
USGS Photograph taken on October 2, 1986, by Lyn Topinka.
[medium size] ...
[large size]
-
GS-39
-
-
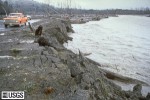
MSH82_bank_erosion_toutle_river_02-22-82.jpg
A major problem to people living downstream of Mount St. Helens was the high sedimentation rates resulting from stream erosion of the volcanic deposits. Streams were continuously down cutting channels, eroding their banks, and eating away at the avalanche and lahar deposits. This material was eventually transported downstream and deposited on the streambeds, decreasing the carrying capacity of the channels and increasing the chances of floods.
USGS Photograph taken on February 22, 1982, by Lyn Topinka.
[medium size] ...
[large size]
-
GS-40
-
-
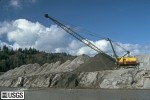
MSH81_dredging_toutle_river_02-05-81.jpg
In order to remove the May 18, 1980 sediment deposits, and to keep up with new sedimentation, the U.S. Army Corps of Engineers began a dredging program on the Toutle (shown here), the Cowlitz, and the Columbia Rivers. By 1987, nearly 140 million cubic yards (110 million meters) of material had been removed from the channels. This is enough material to build twelve lanes of highway, one-foot thick, from New York to San Francisco.
USGS Photograph taken on February 5, 1981, by Lyn Topinka.
[medium size] ...
[large size]
-
GS-41
-
-
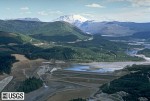
MSH89_sediment_retention_dam_toutle_river_05-89.jpg
In the spring of 1987, construction of a sediment retention dam on the North Fork Toutle River began. This retention dam is designed to help stop the downstream movement of the sediment near where it begins - on the debris avalanche.
USGS Photograph taken in May 1989, by Steve Brantley.
[medium size] ...
[large size]
-
GS-42
-
-
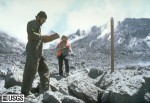
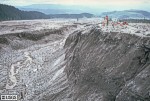
MSH81_USGS_hydrologists_measure_erosion_06-26-81.jpg
U.S. Geological Survey hydrologists measured changes in erosion along
the stream channels affected by the May 18, 1980 eruption.
These measurements were used to study the erosion processes and to
estimate the severity of the sedimentation problem. The view here
is along the Muddy River drainage, approximately one mile (1.5 kilometers)
southeast of the volcano's base. Rod person (lower left) and
instrument persons (upper right) give scale.
USGS Photograph taken on June 26, 1981, by Lyn Topinka.
[medium size] ...
[large size]
-
GS-43
-
-
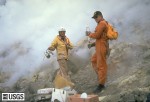
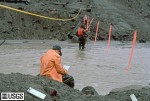
MSH85_USGS_hydrologists_sample_sediment_04-27-85.jpg
Hydrologists measured stream discharge and took water samples to determine how much sediment is suspended in the stream and how much sediment is moving along the streambed.
USGS Photograph taken on April 27, 1985, by Lyn Topinka.
[medium size] ...
[large size]
-
GS-44
-
-
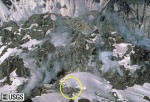
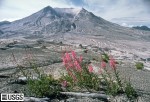
MSH84_st_helens_from_harrys_ridge_fireweed_august_1984.jpg
Fireweed is one species of plantlife which has returned to Mount St. Helens' devastated area. Vegetation began reappearing as early as the summer of 1980 as many small trees and plants were protected by the snowpack on May 18. Seeds, carried by the wind or by animals, also entered the area and grew. By 1985, the ridges surrounding the volcano were covered with new growth.
USGS Photograph taken in August 1984, by Lyn Topinka.
[medium size] ...
[large size]
-
GS-45
-
-
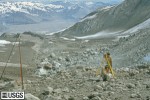
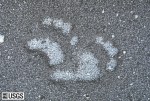
MSH80_bear_tracks_in_ash_and_pumice_october_1980.jpg
Animals also made a comeback soon after the May 18, 1980 eruption. Many smaller animals, such as gophers, mice, frogs, fish, and insects were hibernating below ground or under water on May 18, 1980, and they survived the blast. Larger animals such as bear (whose tracks are shown here), elk, deer, and coyotes have been moving back into the area as their food supplies increase. A mountain goat has even been spotted high on the flanks of the volcano.
USGS Photograph taken in October 1980, by Lyn Topinka.
[medium size] ...
[large size]
-
GS-46
-
-
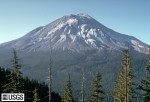
MSH80_st_helens_from_johnston_ridge_05-17-80.jpg
Mount St. Helens on May 17, 1980, one day before the devastating eruption. The view is from Johnston's Ridge, six miles (10 kilometers) northwest of the volcano.
USGS Photograph taken on May 17, 1980, by Harry Glicken.
[medium size] ...
[large size]
-
GS-47
-
-
MSH80_st_helens_from_johnston_ridge_09-10-80.jpg
Mount St. Helens soon after the May 18, 1980 eruption, as viewed from Johnston's Ridge.
USGS Photograph taken on September 10, 1980, by Harry Glicken.
[medium size] ...
[large size]
-
GS-48
-
-
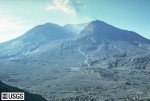
MSH84_st_helens_from_johnston_ridge_09-24-84.jpg
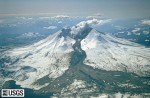
Mount St. Helens four years after the May 18, 1980 eruption, again as viewed from Johnston's Ridge. Note the growth of the lava dome in the crater and the development of the drainage channels around the volcano's flanks.
USGS Photograph taken on September 24, 1984, by Lyn Topinka.
[medium size] ...
[large size]
-
GS-49
-
-
MSH80_st_helens_spirit_lake_before_may_18_1980.jpg
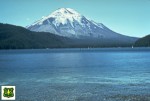
Before the devastating May 18, 1980 eruption, Mount St. Helens was considered to be one of the most beautiful and most frequently-climbed peaks in the Cascade Range. Spirit Lake was a vacation area offering hiking, camping, boating, and fishing.
USFS Photograph taken before May 18, 1980, by Jim Nieland, U.S. Forest Service, Mount St. Helens National Volcanic Monument.
[medium size] ...
[large size]
-
GS-50
-
-
MSH82_st_helens_spirit_lake_reflection_05-19-82.jpg
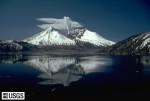
Mount St. Helens and the devastated area is now within the 110,000-acre Mount St. Helens National Volcanic Monument, under jurisdiction of the United States Forest Service. Visitor centers, interpretive areas, and trails are being established as thousands of tourists, students, and scientists visit the monument daily. Mount St. Helens is once again considered to be one of the most beautiful and interesting of the Cascade volcanic peaks.
USGS Photograph taken on May 19, 1982, by Lyn Topinka.
[medium size] ...
[large size] ...
[TIF Format, 18 M]
Return to:
[Mount St. Helens Menu] ...
[Mount St. Helens Photo Archives Menu] ...
[CVO Photo Archives Volcanoes Menu] ...
[CVO Photo Archives Menu] ...

Use of CVO Material and Copyright Information
URL for CVO HomePage is:
<http://vulcan.wr.usgs.gov/home.html>
URL for this page is:
<http://vulcan.wr.usgs.gov/Volcanoes/MSH/SlideSet/ljt_slideset.html>
If you have questions or comments please contact:
<GS-CVO-WEB@usgs.gov>
12/04/07, Lyn Topinka
 Use of CVO Material and Copyright Information
 [Image,16K,GIF]


 [Image,21K,GIF]