| US Imports of Steel Mill Products | |||
| FOR Strip-Hot Rolled -- C & A |
|||
| Quantity in Metric Tons | |||
| Same Table - US Dollars |
Same Table - Average Unit Value |
||
| 'C & A' = Carbon and Alloy products, 'S' = Stainless products | |||
| Graph | Country | Census Data | Preliminary Census Data |
License Data | |||||||||||||
|---|---|---|---|---|---|---|---|---|---|---|---|---|---|---|---|---|---|
| AUG07 | SEP07 | OCT07 | NOV07 | DEC07 | JAN08 | FEB08 | MAR08 | APR08 | MAY08 | JUN08 | JUL08 | AUG08 | SEP08 | SEP08 | OCT08 | ||
| M | WORLD | 6,601 | 5,967 | 5,791 | 5,525 | 4,113 | 4,384 | 4,540 | 3,375 | 5,040 | 4,610 | 2,665 | 2,938 | 3,563 | 3,462 | 2,967 | 2,132 |
| M | CANADA | 5,328 | 4,743 | 4,582 | 3,608 | 3,391 | 3,335 | 3,510 | 2,638 | 3,279 | 3,446 | 2,004 | 1,819 | 1,993 | 2,079 | 1,947 | 1,390 |
| M | MEXICO | 897.2 | 788.7 | 866.3 | 753.8 | 608.9 | 712.4 | 566.3 | 554.9 | 896.3 | 948.2 | 316.6 | 331.7 | 1,377 | 807.7 | 474.4 | 316.3 |
| M | UNITED KINGDOM | 326.0 | 244.0 | 206.7 | 47.3 | 6.50 | 25.2 | 337.5 | 152.0 | 718.7 | 76.1 | 163.1 | 467.6 | 30.2 | 457.4 | 160.9 | 198.4 |
| M | JAPAN | 25.4 | 41.8 | . | 929.7 | 51.5 | 12.5 | 101.9 | . | 5.49 | 52.6 | 19.6 | 113.3 | 33.8 | 63.3 | 67.8 | 1.69 |
| M | TAIWAN | . | . | . | . | . | . | . | . | . | . | . | 206.7 | . | . | . | . |
| M | AUSTRALIA | . | 90.4 | 100.5 | . | 55.1 | 130.8 | . | . | . | . | . | . | 43.7 | 41.8 | . | . |
| M | GERMANY | 20.1 | 0.47 | . | . | . | 156.8 | 1.09 | 11.5 | 80.6 | . | . | . | 79.0 | . | . | 93.4 |
| M | TURKEY | . | . | . | 50.1 | . | . | 16.0 | . | . | . | . | . | 4.89 | 13.1 | 8.05 | . |
| M | AUSTRIA | . | 1.28 | . | . | . | . | . | . | . | . | . | . | . | . | . | . |
| M | BRAZIL | . | 14.8 | . | . | . | . | . | . | . | . | . | . | . | . | 0.58 | . |
| M | CHINA | . | . | 31.3 | . | . | . | . | . | . | . | . | . | . | . | . | . |
| M | INDIA | . | 30.2 | . | . | . | . | . | . | . | . | . | . | . | . | . | . |
| M | ITALY | 3.76 | . | . | 117.9 | . | 6.23 | . | . | . | . | . | . | . | . | . | . |
| M | KOREA | . | 3.52 | 3.92 | . | . | . | . | . | . | . | . | . | . | . | . | 0.35 |
| M | MALAYSIA | . | 4.47 | . | 4.38 | . | 5.01 | 6.72 | . | . | 8.36 | . | . | . | . | . | . |
| M | PERU | . | . | . | 13.7 | . | . | . | . | . | . | 19.3 | . | . | . | . | . |
| M | SLOVENIA | . | 4.08 | . | . | . | . | . | . | 5.88 | . | . | . | . | . | . | . |
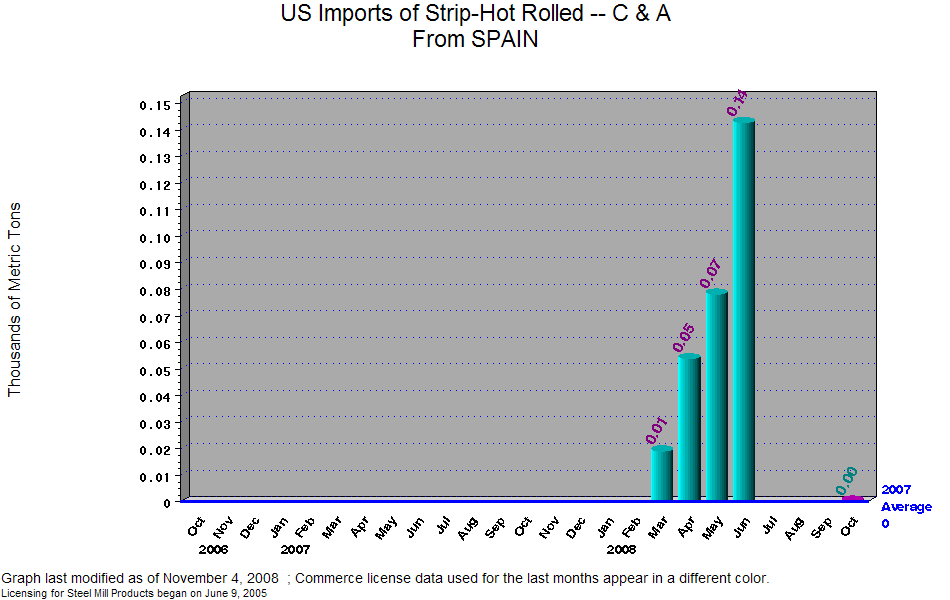
| M | SPAIN | . | . | . | . | . | . | . | 19.1 | 53.8 | 78.2 | 142.7 | . | . | . | . | 0.29 |
| M | UNITED STATES | . | . | . | . | . | . | . | . | . | . | . | . | . | . | 308.7 | 131.5 |
| SOURCE: US Department of Commerce, Import Administration |
| Table last modified on: November 4, 2008, with |
| Licensing data collected through November 4, 2008 and |
| Preliminary Census data compiled through September 2008 |
| Data listed in order of descending volume imported during last THREE months of Census data, including peliminary data |
| Steel mill categories are defined by 10-digit HTS codes |
| To see License Data at HTS 6-digit level click on chart title at the top of the page. |
| Link to Annual Summary of Census Data |
| Link to Summary Level of Monthly Census Data |