|
Using National Data to Simulate Metropolitan Area Household Travel Data
PETER R. STOPHER 1 *
STEPHEN P. GREAVES 2
MIN XU 3
ABSTRACT
This paper describes the overall approach to simulating household travel survey data, and provides an overview of the results from three metropolitan areas in the United States and two in Australia using the 1995 Nationwide Personal Transportation Survey data. The applications we use demonstrate the benefits of the approach that could save substantial amounts of money on data collection. We identify the need for improvement of the approach and propose a new procedure for simulating trip tours and their characteristics, instead of trips. The paper concludes by providing the preliminary findings based on tours as the unit of analysis using the 2001 National Household Travel Survey.
KEYWORDS: Household travel survey data, Classification and Regression Trees (C&RT), Monte Carlo simulation, microsimulation, Bayesian updating, trip tours.
INTRODUCTION
Household travel surveys (HTSs) are increasingly expensive to undertake (Schofer 2002). In addition, problems with response rates, misreporting of travel, and the increasing difficulty of conducting computer-assisted telephone interview (CATI) surveys make it likely that the HTS as we know it will have to change significantly in the future. For modeling purposes, sample sizes of 3,000 households and upwards are required irrespective of the size of the region, putting an adequate sample size beyond the reach of many urban areas.
Concurrent with the increasing expense and difficulties of obtaining HTS data is the demand for greater spatial coverage of the sample within a region to support micro-level planning along transport corridors and within subareas. Finally, there is greater interest in obtaining statewide HTS data. This may entail surveys in both small urban and rural areas, which are potentially more expensive to conduct than the standard metropolitan HTS. Survey sample sizes for rural and small urban areas are likely to be relatively small, although the desire may still be to produce models for each such geographic grouping.
In an effort to find an alternative to the large-scale HTS, recent research has aimed at developing a method to simulate HTS data (Greaves 2000; Greaves and Stopher 2000; Stopher et al. 2003). The method uses distributions of travel characteristics obtained from a nationwide sample that are updated to a specific locality using a small local update sample and Bayesian updating with subjective priors. A Monte Carlo simulation of specific travel attributes is performed, namely, the number of trips by purpose, and, for each simulated trip, the main mode of travel, the time of departure, and the trip duration. All of the U.S. work reported to date (covering Baton Rouge, Dallas, and Salt Lake City) uses the 1995 Nationwide Personal Transportation Survey (NPTS) as the source for the distributions. The U.S. distributions have also been used to simulate HTS data for Adelaide and Sydney in the Australian cases because of the lack of a recent nationwide travel survey (Stopher et al. 2003; Pointer et al. 2004).
Overall, the results so far have demonstrated the method capable of creating HTS data that are a reasonable approximation to observed data in a variety of urban settings. This said, several needed enhancements to the methods have also been identified, chief among them is replacing the trip-based method with a tour-based simulation method. Following a synopsis of the progress to date, this paper provides the rationale for this latest development, together with our initial thoughts on how one should classify tours for the purposes of simulation and, ultimately, how to simulate the tours using the 2001 Nationwide Household Travel Survey.
Clarifying the Role of Simulated HTS Data
While the rationale for simulating HTS data is apparent, the role those data should play within the travel forecasting landscape has proven more contentious. At the heart of this debate is whether it is appropriate to use simulated data as an input to another modeling procedure that may be based on different underlying assumptions from those used to generate the data. If the various elements (e.g., trips, destination, modes, routes) are modeled separately, as is predominantly the case in practice, then it is arguably an appropriate application. However, problems could arise when the simulated HTS data are used to estimate models based on interdependent relationships, which typify most disaggregate modeling applications. For instance, problems could exist with the mode-choice step of current procedures, because this is typically done at a disaggregate level. One other area where problems could occur is within the simulated data because of the built-in assumptions as to city size and public transport service, albeit averages generated from a nationwide sample. Nevertheless, it is possible that there are inherent assumptions that may even run contrary to those used in an aggregate model of trip distribution, for example. However, if simulated data can be generated that are themselves a function of such things as city size and transport networks, then this objection would largely evaporate.
In light of this issue and the well-voiced concerns with conventional models (whose structures have been somewhat dictated by data restrictions anyway), the possibility that a simulation-based approach can generate data for large samples and even entire populations suggests that a more fruitful direction could be in the use of national data to estimate travel in a local region.
OVERVIEW OF THE SIMULATION APPROACH
The method proceeds through the steps depicted in figure 1. Initially, the NPTS data were classified using the Classification and Regression Tree (C&RT) method (Breiman et al. 1984) into behaviorally homogeneous groupings based on the pertinent trip attributes of interest: trip rates by purpose, mode, departure times, and trip durations in minutes. In the delineation of the categories, while attempts were made to build characteristics of the metropolitan area and transport supply directly into the categories used in the simulation, these added little to the explanation and therefore were included indirectly through the local data updating procedures described in a later section.
Table 1 presents the household classifications for predicting home-work, home-school, and home-other trip rates used in the simulation (Greaves and Stopher 2000). The generalized linear modeling results indicate both the statistical significance of the groupings (F-statistic) and the proportion of variance explained by the schemes (R2). The remaining trip attributes use categories based on household demographics and the prior simulated attribute. This is indicated for mode in table 2 for selected trip purposes.
Having created the categories, we next developed the distributions for each category. For trip purpose, the distributions represent the relative frequency that zero, one, two, or more trips would be produced by the household for that purpose (illustrated in figure 2 as a cumulative relative frequency graph using the example of home-work trips). In the case of mode, the distributions represent the relative frequency of taking each of the five modes indicated in table 2 (an example is shown for home-work modal trips in figure 3).
It should be noted that a considerable amount of data are required to construct reliable distributions. In using the 1995 NPTS data, we removed certain records based on missing data and proxy reporting, so that the final number of household records available for the C&RT analysis, the development of frequency distributions, and the Monte Carlo simulation was 30,400. Our simulation used random numbers that were treated as probabilities. Each probability was then read from the cumulative distribution and the value corresponding to it picked from the distribution and assigned to the household or trip of concern.
Next a sample of households was drawn (not micro-simulated) using real households from census data. In our U.S. applications, we used the 5% Public Use Micro-Data Sample (PUMS), providing unit records for "long-form" households in the decennial census. In the Australian work, the Australian Bureau of Statistics produces the Household Sample File (HSF), which contains full unit records for 1% of the households in the five-year Australian census. In both cases, to protect the confidentiality of the records, the geographic location of the household was given only at a large geographic area level, so that the actual location of the household, with respect to the transport system, was not known. In the case of the PUMS data, households were given weights in the data, because they were not sampled uniformly into the PUMS. In using the PUMS data, prior to sampling, each household was replicated the number of times appropriate for its weight. In the HSF data, households were sampled on a strictly random basis, so that each household represented 100 households.
Next, a sample design was chosen. In many HTSs, the sample will be stratified geographically, and then by household size and number of vehicles in the household. The first stratification is usually a disproportionate sample, to ensure that there is either a statistically or politically adequate sample in each geographic subregion of the study area (e.g., a sufficient sample in each county for a multi-county region). To reduce sampling costs, the household size and number of vehicles stratification is usually designed as a proportionate sample. Such a sampling scheme can be used, provided that the census subdivisions used to record the PUMS or HSF data correspond roughly to the geographic subregions for sampling.
In this case, the unit record data were first grouped into the appropriate geographic subdivisions for each of which a sampling goal was established, so that there was a known distribution of households required by cell of a household size by vehicle availability matrix. Households were then randomly sampled from the unit records. The sampling was undertaken without replacement, because each household unit record appeared multiple times in the region, based on its weight. This does mean, however, that some household unit records may have been used more than once in a sample, to represent the appropriate stratified random sample.
Once households were sampled, we had complete sociodemographic data on the household, allowing us to determine the specific group to which the household belonged for each travel characteristic to be simulated. This permitted us to draw the travel characteristics from the appropriate distributions for each travel characteristic and to simulate an entire day's worth of travel for the household. Initially, we simulated the number of trips by each trip purpose made by the household. From this point on, the simulation related to each individual trip that had been simulated for the household, for which mode, time of departure, and trip duration were each simulated, conditional on the preceding travel characteristics.
In standard Monte Carlo simulation, it is customary to make many hundreds of drawings from the distributions for each characteristic and then to average the results. However, in our case, because we were usually simulating thousands of households and tens of thousands of trips, we found it unnecessary to use repetitive drawings, especially when the results were to be used in an aggregate manner. In effect, the thousands of households for which travel was to be simulated and the tens of thousands of trips for which characteristics were to be simulated approximate the normal Monte Carlo procedure of multiple drawings.
Bayesian Updating
In the early simulations for Baton Rouge, Dallas-Fort Worth, and Salt Lake City, we found that while trip rates were reproduced reasonably well based on a purely demographic categorization of the population, not surprisingly, mode shares and trip lengths were not. To address this, we then included measures of transportation supply, urban area size, density, and other contextual measures in the categorization known to correlate with travel. However, despite repeated attempts, this approach produced only marginal improvements in the simulation results.
As a consequence, we explored alternative methods in which we assumed that while a full HTS of 3,000 or more households may be out of the budget of the area of concern, a small HTS of, say, 300 to 750 households might be feasible to adjust/update the information coming from the national survey. The original rationale for this approach was taken from the literature on travel-behavior model transferability between regions, which consistently demonstrates that the quality of the transfer is substantially improved if local data (particularly from a small sample of households) are available to update model parameters (Atherton and Ben-Akiva 1976; Badoe and Miller 1995). In our case, we applied similar logic to update the travel data, in this case by updating the NPTS probability distributions that drove the simulation.
For this research, we used Bayesian updating with subjective priors, a procedure used in model updating (Koppelman et al. 1985). Under this procedure, an unknown parameter θ is related to its prior distribution and the likelihood function of the local data by the probability expression:
(Posterior probability of θ given the local data) ∝ (prior probability of θ) * (likelihood function of the local data given θ
The critical issue with using Bayesian updating is to define the prior distribution of θ. The most widely used approach is to assume θ is normally distributed with mean θt and variance σt. Similarly, the sampling distribution of the local data is assumed to be normally distributed with mean θs and variance σs. This assumption (conjugate prior) enables data from the two sources to be combined to produce a posterior distribution that is also normally distributed with parameters θp and variance σp that are calculated as follows:
θp = [ θt / σ2t + θs / σ2s ] / [ 1 / σ2t + 1 / σ2s ] (1)
σ2p = [ 1 / σ2t + 1 / σ2s ] (2)
Equation 1 shows that θp was derived from the prior and local samples, which had effectively been weighted by the inverse of their respective variances. These weights can be altered manually if they are deemed inappropriate. As a practical matter, the discrepancy in sample size between the update sample and the NPTS sample meant that without some manual adjustment of weights no effects were observed. However, it is clearly important that this manual adjustment is done based on sound reasoning.
The method was applied by updating the frequencies at each appropriate value of the distributions to be used in the simulation to produce modified distributions. Given that each interval was treated as a proportion, an estimate was needed for the standard error of the share (this is actually analogous to the standard deviation of the sampling distribution of a sample proportion). This can be derived from the following expression, although it must be noted that this requires five or more estimates for the assumption of normality to hold. This was problematic given the size of the update sample and the level of disaggregation used in the categorization schemes.
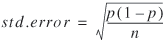
where the sample proportion x/n is substituted for p, x = share, and n = sample size.
The impact of Bayesian updating of the distributions is illustrated by the case of simulating the mode of travel for home-work trips in Sydney, Australia (Pointer et al. 2004). In this case, 300 Sydney households were drawn randomly and their information used to update the NPTS distributions (shown in figure 3) to those shown in figure 4. The impact of the updating is apparent. In particular, the large increase in rail travel and the decline in car driver trips were consistent with what we would expect. The evidence from this updating experiment suggests that a local sample of about 500 households might be an optimal balance between the costs of surveying additional households and accuracy of prediction.
APPLICATIONS
Summary of Previous Applications
In work reported to date, this procedure has concentrated on applications for demonstration purposes and has been restricted to running the simulations to replicate an actual HTS. Initial work was performed using Baton Rouge as a test case. We selected Baton Rouge because its household travel survey was conducted immediately following the NPTS and used the exact same survey methods and materials. This meant there would be no intervening problems of methodological difference in data collection between the survey used for comparison and the source of the simulation. Results from this test were encouraging, showing generally only small numeric differences between the simulations and the actual HTS (Greaves and Stopher 2000). Subsequent work with Baton Rouge data included initial tests of Bayesian updating, which improved most of the data fits to the original household travel survey (Greaves 2001).
Since the original Baton Rouge work, the methods have been tested in four regions with markedly different demographic, transport, and urban form characteristics: Dallas-Fort Worth, Salt Lake City, Adelaide, and Sydney. In the case of the two Australian cities, the original NPTS distributions served as the source of the simulated travel data and the HSF was used as the source of the local demographic data. In all cases, while there were numerical differences in most of the travel characteristics produced from the simulations, aggregate totals of trips by purpose, by mode, by time of day, and by trip duration were generally within 2% to 5% of the actual results of the household travel surveys (Stopher et al. 2001; Stopher et al. 2003). In all cases, Bayesian updating produced marked improvements in these figures. In the Sydney application, we also explored the effects of sample size requirements for the Bayesian updating, concluding a sample of about 500 households represented a minimum desired number in this particular case (Pointer et al. 2004).
Potential Uses of the Simulations
Overall, the results have been encouraging. Using a Monte Carlo simulation of travel characteristics appears to be viable to replace or augment standard household travel surveys, especially if Bayesian updating is undertaken with a small local sample (about 500 households) for updating purposes. In the United States, it has been suggested that simulated data could be used to create a database for smaller metropolitan areas that lack sufficient resources to undertake a full HTS (i.e., a sample of 3,000 or more households). In place of this, such areas can undertake a small sample of about 500 households and then undertake simulation of a sample as large as may be desired, up to and including the entire metropolitan population.
In Australia, somewhat different applications have been suggested. First, it can be used as a means to increase the sample available for subregional and corridor planning, where a small sample may be available from a metropolitan HTS that can be used for Bayesian updating. Second, it can be used to augment the sample sizes for extending metropolitan surveys into the nonmetropolitan areas of states or to full statewide surveys. In this context, a state may be subdivided into regions and a small sample drawn for each, which is then extended by simulation to provide a much larger sample for each major area of the state.
The simulated data represent a much cheaper option than a full HTS. In general, the creation of a simulated dataset of almost any size, with Bayesian updating, would cost about $20,000 to $30,000. A small sample of 500 households, using current average costs for a CATI survey, is likely to cost about $100,000, giving a total cost of the simulated dataset of less than $130,000. This compares favorably to the cost of a full survey of 3,000 or more households, which could cost in excess of $500,000.
In all of the above applications, the data could be used just like actual HTS data, that is, as an input to model estimation or calibration. However, as suggested in the early part of this paper, another alternative is to apply the data directly in forecasting. This could be done with a second simulation, in which the future characteristics of households are simulated from the present, using an available microsimulation procedure (Chung and Goulias 1997) and then re-running the simulation of the travel characteristics with the new distribution of household demographics.
Limitations of the Current Simulation Methods
One limitation of the simulation procedure is that the lack of transport system characteristics will show little or no difference in travel patterns, irrespective of changes made to the transportation system. That is, total numbers of trips by purpose, by mode, by time of day, and by trip length would not vary as changes are made to the system, in contrast to travel patterns revealed by trip distribution and assignment models, where the actual destinations and routes chosen may change. However, modeling trip distribution and assignment is generally not possible as a result of the lack of geographic specificity in the simulation.
Another problem that arises from current simulations is that disaggregation of the simulated data will reveal potential inconsistencies in the data. In this procedure, trips are simulated independently of each other, even at the household level, which results in two undesirable properties. The first applies to households and individuals making no trips. The simulations always underestimate the number of households reporting no travel on the travel day compared with the actual HTS. This occurs because of the independence in the generation of trip numbers by purpose. The probabilities associated with zero trips for any purpose are generally quite small. The simulated probability of a household making no trips is the product of the individual probabilities of zero trips for all trip purposes, which will be very low. In reality, there is interdependence among the trips and also in a household generating no trips on a given day. For example, a household with workers, none of whom make a work trip on a given day, may be much more likely to be a zero-trip household. This interdependence is not present in the trip-based simulations.
The work-around for this problem in the applications described in the previous subsection was to estimate values for trip-making households only and compare them, and then to estimate the number of zero trip-making households separately, based on the actual HTS. This works when there is an actual HTS but becomes problematic when the simulation is performed as a substitute for an HTS.
The second inconsistency arises from the independence of the simulations of both trips by purpose and the characteristics of each trip. The following scenario could occur in a simulation. A household is simulated to have three home-based work (HBW) trips, one home-based school (HBSch) trip, one home-based shopping (HBSh) trip, and one nonhome-based (NHB) trip. The household has two workers (both adults) and one school age child. The first problem is that some members of the household may be unable to return home, because there are not sufficient return trips to get everyone home by the end of the day. For example, we could hypothesize that one person went to work, came home, and did nothing else (two HBW trips). A second person could have gone to work, then gone from work to shop, and then returned home (one HBW trip, one NHB trip and one HBSh trip). The child in the household then went to school, but there is no trip left to get the child home again. In addition, the mode of one HBW trip might be car driver, one might be car passenger, and one might be bus, while the HBSch trip is by walk, the HBSh trip is by bicycle, and the NHB trip is by bus. This makes little sense, because the car is not driven home by a household member, and the bicycle also either never returns home or is picked up at the shopping location. Furthermore, times of day may not match our inferences here—all the HBW trips and the HBSh trip may have a morning time of departure, while the HBSch and NHB trips may have an afternoon departure time. There is also no reason for the durations of these trips to resemble one another. Another problem would be a household that is simulated as making one trip only, which might even be a NHB trip.
In aggregate analysis, none of the above matters, because the trip totals by purpose, mode, time of day, and duration will provide reasonable descriptions for a population. However, these aspects of independence in the trip simulation make it impossible to disaggregate the data below a certain point and also preclude the simulation of the geographic location of trip ends. Therefore, to be able to introduce the geographic aspects of trip making into the simulated data, it is clearly necessary to change the simulation procedure so that disaggregation is possible and produces sensible results. In addition, dependence among simulated trips will also permit better simulation of the number of nonmobile households on a given day. How dependence on the transport service can be introduced is more problematic and is not directly solved by the steps that may be necessary to introduce trip dependence. However, these issues are explored more in the next section of this paper.
SIMULATING TOURS
Our initial thinking on how to resolve these problems was to simulate first whether a household would make trips or not, then the (nonzero) number of trips, and then the purposes of those trips. However, while this would deal with two of the problems, namely the correct number of zero-trip households and having an appropriate number of trips for a household, it would not take care of the problem of simulating illogical or unrealistic combinations of trip purposes, departure times, or trip durations. On further consideration, it seemed most productive to move away from simulating trips to simulating tours instead.
We define a tour, similar to the Adler and Ben-Akiva (1979) definition of it in their early work, as a "set of consecutive trip links that begin and end at an individual's home." We chose to depart from this by using a set of trip links that may begin and end at home, defining a home-based tour, or that may begin and end at work, defining a work-based tour. This conforms a little more closely to a definition suggested by Axhausen (2000) that a tour is any sequence of trip links that begin and end at the same location.
Home-based or work-based tours can also be either simple or complex. A simple tour involves only one other activity and is accomplished with two trips, for example, a trip from home to work, followed by one from work to home, or a trip from home to shop and a trip from shop to home. A complex tour is any tour involving multiple stops, such as a trip from home to school to work to shop to school to home. Both work-based tours and home-based tours can be simple or complex.
The literature describes many possible ways to classify tours. We have followed a scheme proposed by Strathman and Dueker (1995) and modified by O'Fallon and Sullivan (2004). Table 3 presents O'Fallon and Sullivan's classification where stops shown in parentheses may occur zero, one, or more times. We modified this further to separate out the simple from complex tours. Also, at this stage, it is not clear that the simulation would call for as many classifications into "to work," "from work," etc. Our preliminary modification of this is shown in table 4. The same interpretation of the stops in parentheses applies in table 4 as in table 3.
The next issue was how to simulate the tours. There are two approaches, referred to in the literature as sequentialand simultaneous/holisticapproaches. Sequential approaches involve the incremental generation of each trip or activity in the tour, based on previous elements of the tour (Kitamura et al. 1997). Simultaneous approaches involve the initial generation of the entire tour/pattern; such an approach is used in the TRANSIMS framework, where activity tours are generated for each household (Vaughn et al. 1997). Evidence and intuition suggest entire tours may provide a more tangible method by which to categorize households, which is an essential component of the methodology we are developing (Kulkarni and McNally 2001).
A cautionary note on the simultaneous approach is that, in defining categories of tours, complex and rare chains must not be excluded, because this will result in an underestimation of the number of trips. For simple tours, this is not a problem. However, for complex tours, which may involve (based on our preliminary analysis of the U.S. National Household Travel Survey (NHTS) reported below) up to 15 stops on a tour, this is an issue. We, therefore, took a two-tiered approach in which we first simulated whether the tour was simple or complex. Then, for each complex tour, we simulated the number and subsequent purpose of each stop on the tour. In essence, this combined elements of both the simultaneous and sequential approaches.
USING THE NHTS AS A SOURCE OF TOURS
We processed the NHTS data into 47,648 tours, starting from 134,400 trips. In comparison, O'Fallon and Sullivan (2004) reduced 124,089 trips to 37,565 tours from the 1997/1998 New Zealand HTS. This represents a reduction to 30.3%, which is very similar to the 35.5% reduction that we achieved.
From the classification into tours, 22 tours were from home to home with no intervening stops. These were presumably for such activities as exercise, walking the dog, or simply where something was forgotten and the trip was abandoned for a return to home. There were 81 tours that included missing purposes. These required additional processing to be usable, but were included in the unclassified group of trips in the following analysis. There were also eight trip chains that did not represent a tour, because they did not start from either home or work and did not end at the place where they started. These may also be erroneous records and will be checked further.
We found that the maximum number of intermediate stops in a tour was 14. There were only six tours that had this many stops. The typology of table 4 requires considerable further manipulation of the data to determine how many tours of each type exist in the NHTS data. This manipulation has not yet been done, including splitting out the work-based tours. However, to give an idea of the profile of tours in the NHTS data, table 5 presents a basic count. It is interesting to note, from this preliminary analysis, that simple tours comprise a total of 59.7% of all home-based tours. Of the complex tours, just under one-third involve an initial stop at work or school.
CONCLUSIONS
Previous research, using the 1995 NPTS data and PUMS or the HSF, has shown that simulating household travel characteristics using a Monte Carlo simulation, especially with Bayesian updating with subjective priors, produces reasonable approximations to actual travel characteristics obtained from HTSs. This suggests that this simulation method may be highly productive for generating HTS data, especially under circumstances where budgets do not permit collecting a normal sample size or where needs exist for much larger than usual samples.
This paper presents some shortcomings of the original approach, particularly issues relating to the independent simulation of trips and their characteristics. These appear to be susceptible to mitigation by changing from a trip-based to a tour-based simulation. In light of that, we have also shown that the 2001 NHTS appears suitable as a source of data for a Monte Carlo simulation of household tours. In addition, preliminary analysis of the tour-based data indicates that the NHTS data contain a sufficient number of tours for the distributions, while there is scope for exploring some alternative typologies of tours that may be more useful for simulation. The tour-based approach is also a necessary step for including a geographic simulation of the stop locations. The geographic simulation is essential if the resulting trips are to be loaded on a network, in order to investigate impacts on transport infrastructure, etc.
The NPTS data originally, and now the NHTS data, represent an invaluable resource for this work. The transfer of the distributions to Australia has worked better than expected. Given that there are still relatively few nations that undertake a nationwide travel survey on a periodic or continuing basis, the U.S. nationwide surveys have made an important contribution to this field of research.
REFERENCES
Adler, T. and M. Ben-Akiva. 1979. A Theoretical and Empirical Model of Trip Chaining Behaviour. Transportation Research, Part B13:243–257.
Atherton, T.J. and M.E. Ben-Akiva. 1976. Transferability and Updating of Disaggregate Travel Demand Models. Transportation Research Record794:1–8.
Axhausen, K. 2000. Definition of Movement and Activity for Transport Modelling. Handbooks in Transport: Transport Modelling.Edited by D. Hensher and K. Button. Oxford, England: Elsevier.
Badoe, D.A. and E.J. Miller. 1995. Comparison of Alternative Methods for Updating Disaggregate Logit Mode Choice Models. Transportation Research Record1493:90–100.
Breiman, L., J.H. Friedman, R.A. Olshen, and C.J. Stone. 1984. Classification and Regression Trees.Belmont, CA: Wadsworth International Group.
Chung, J. and K.G. Goulias. 1997. Travel Demand Forecasting Using Microsimulation: Initial Results from a Case Study in Pennsylvania, Proceedings of the 76th Annual Meetings of the Transportation Research Board,Washington, DC.
Greaves, S.P. 2000. Simulating Household Travel Survey Data in Metropolitan Areas. Unpublished Ph.D. dissertation, Department of Civil and Environmental Engineering, Louisiana State University, Baton Rouge.
______. 2001. Local Sample Updates for Synthetic Household Travel Survey Data, Proceedings of the 23rd Conference of Australian Institutes of Transport Research,CD-ROM, Monash University, Australia, December 2001.
Greaves, S.P. and P.R. Stopher. 2000. Creating a Simulated Household Travel/Activity Survey: Rationale and Feasibility Analysis. Transportation Research Record1706:82–91.
Kitamura, R., C. Chen, and R.M. Pendyala. 1997. Generation of Synthetic Daily Activity-Travel Patterns, Proceedings of the 76th Annual Meetings of the Transportation Research Board, Washington, DC.
Koppelman, F.S., G.K. Kuah, and C.G. Wilmot. 1985. Transfer Model Updating with Disaggregate Data. Transportation Research Record1037:102–107.
Kulkarni, A.A. and M.G. McNally. 2001. A Microsimulation of Daily Activity Patterns, Proceedings of the 80th Annual Meetings of the Transportation Research Board,Washington, DC, 2001.
O'Fallon, C. and C. Sullivan. 2004. Trip Chaining: Understanding How New Zealanders Link Their Travel, Research Report to Transfund New Zealand. September.
Pointer, G., P. Stopher, and P. Bullock. 2004. Monte Carlo Simulation of Sydney Household Travel Survey Data with Bayesian Updating Using Different Local Sample Sizes, Proceedings of the 83rd Annual Meetings of the Transportation Research Board, Washington, DC, 2004.
Schofer, J.L. 2002. National Household Travel Survey, letter report to the Committee to Review the Bureau of Transportation Statistics Survey Programs, Washington, DC, June 18.
Stopher, P.R., P. Bullock, and J. Rose. 2003. Simulating Household Travel Data in Australia: Adelaide Case Study. Road and Transport Research12(3):29–44.
Stopher, P.R., S.P. Greaves, and P. Bullock. 2001. Synthesizing Household Travel Survey Data: Application to Two Urban Areas, Proceedings of the 82nd Annual Meetings of the Transportation Research Board,Washington, DC, 2003.
Strathman, J. and K. Dueker. 1995. Understanding Trip Chaining. Special Reports on Trips and Vehicle Attributes, 1990 Report Series. Washington, DC: U.S. Department of Transportation, Federal Highway Administration. February.
Vaughn, K.M., P. Speckman, and E.I. Pas. 1997. Generating Household Activity-Travel Patterns (HATPs) for Synthetic Populations, Proceedings of the 76th Annual Meetings of the Transportation Research Board, Washington, DC.
ADDRESSES FOR CORRESPONDENCE
Corresponding author: P. Stopher, Institute of Transport & Logistics Studies (C37), The University of Sydney, NSW 2006,
Sydney, Australia. E-mail: peters@itls.usyd.edu.au
S. Greaves, Institute of Transport & Logistics Studies (C37), The University of Sydney, NSW 2006,
Sydney, Australia. E-mail: stepheng@itls.usyd.edu.au
M. Xu, Transport & Population Data Center (TPDC), New South Wales Department of Planning, GPO Box 39, NSW 2001, Sydney, Australia. E-mail: min.xu@dipnr.nsw.gov.au
|
|