| All Steel Mill Products |
| M |
All Steel Mill Products |
73,336 |
10,501 |
33,769 |
56,273 |
1,851 |
13,712 |
57,701 |
70,755 |
124,047 |
73,451 |
49,268 |
129,421 |
138,282 |
73,983 |
56,014 |
71,214 |
| Carbon and Alloy Products |
| M |
All Carbon and Alloy Products |
73,244 |
10,501 |
33,768 |
56,273 |
1,851 |
13,712 |
57,701 |
70,755 |
124,047 |
73,451 |
49,268 |
129,421 |
138,268 |
73,983 |
56,014 |
71,214 |
| M |
Blooms, Billets and Slabs -- C & A |
54,506 |
251.4 |
20,238 |
40,535 |
58.6 |
. |
51,184 |
50,362 |
97,278 |
53,552 |
44,229 |
89,755 |
106,027 |
40,375 |
40,375 |
40,445 |
| M |
Plates in Coils -- C & A |
. |
. |
. |
. |
. |
. |
. |
. |
. |
. |
. |
4,371 |
18,244 |
11,472 |
2,881 |
. |
| M |
Plates Cut Lengths -- C & A |
597.6 |
1,481 |
. |
973.0 |
. |
7,585 |
. |
5,810 |
2,821 |
6,276 |
959.8 |
12,089 |
2,124 |
10,685 |
7,040 |
7,286 |
| M |
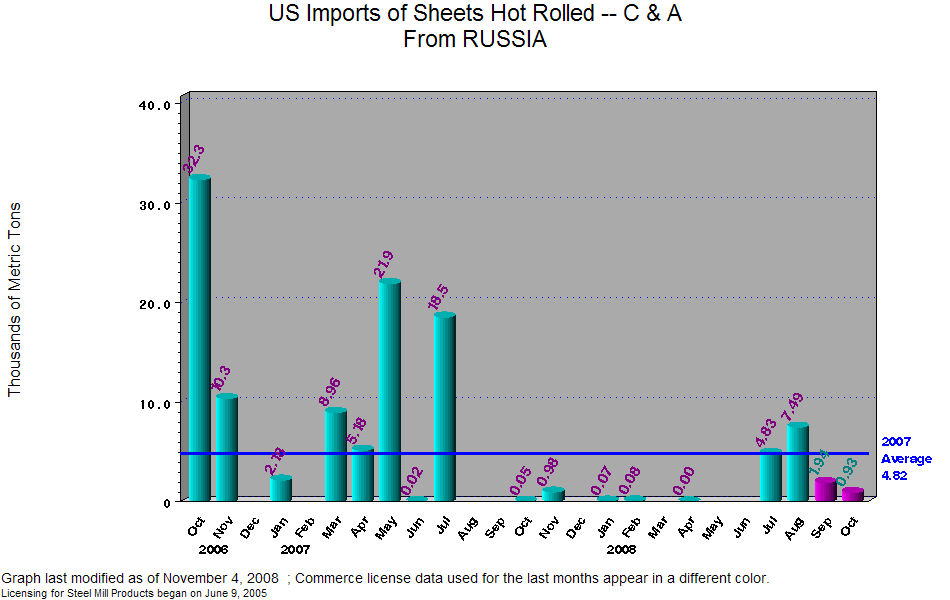
Sheets Hot Rolled -- C & A |
. |
. |
57.5 |
984.3 |
. |
79.6 |
86.4 |
. |
6.09 |
. |
. |
4,835 |
7,494 |
7,002 |
1,946 |
938.0 |
| M |
Oil Country Goods -- C & A |
1,657 |
3,751 |
144.3 |
3,860 |
. |
1,469 |
2,732 |
2,632 |
3,039 |
2,474 |
2,887 |
5,269 |
3,524 |
1,632 |
599.1 |
6,250 |
| M |
Line Pipe -- C & A |
1,884 |
. |
5,356 |
. |
. |
521.2 |
. |
1,897 |
3,495 |
. |
. |
7,241 |
. |
731.2 |
691.3 |
3,825 |
| M |
Sheets & Strip-Electrical -- C & A |
1,569 |
826.2 |
536.8 |
2,939 |
1,402 |
1,712 |
1,183 |
1,745 |
1,607 |
1,123 |
1,027 |
1,209 |
607.0 |
1,426 |
1,558 |
1,946 |
| M |
Standard Pipe -- C & A |
470.8 |
4,008 |
2,162 |
1,284 |
1.45 |
2,001 |
2,290 |
1,134 |
647.2 |
1,288 |
1.09 |
1,748 |
1.15 |
1.48 |
3.85 |
0.69 |
| M |
Bars-Cold Finished -- C & A |
2,560 |
. |
3,120 |
5,322 |
. |
. |
5.02 |
. |
9,498 |
694.9 |
. |
1,324 |
. |
84.4 |
84.4 |
7,446 |
| M |
Mechanical Tubing -- C & A |
338.4 |
0.69 |
1,205 |
0.74 |
1.03 |
0.77 |
0.62 |
752.0 |
412.8 |
190.4 |
. |
1,254 |
133.6 |
. |
0.30 |
2,830 |
| M |
Tool Steel -- C & A |
463.6 |
172.2 |
645.7 |
358.2 |
379.2 |
228.1 |
. |
540.4 |
175.6 |
229.1 |
162.8 |
313.1 |
111.8 |
561.7 |
595.0 |
238.6 |
| M |
Wire Drawn -- C & A |
78.1 |
7.38 |
. |
. |
3.41 |
113.6 |
100.4 |
. |
. |
. |
. |
6.73 |
. |
6.08 |
6.08 |
. |
| M |
Bars-Hot rolled -- C & A |
173.0 |
2.96 |
2.61 |
2.45 |
. |
. |
106.1 |
1.07 |
172.3 |
8.52 |
. |
. |
. |
4.89 |
232.7 |
2.47 |
| M |
Pressure Tubing -- C & A |
0.09 |
. |
2.75 |
. |
. |
. |
. |
. |
. |
1,060 |
. |
. |
. |
. |
. |
. |
| M |
Sheets & Strip Galv Electrolyt -- C & A |
. |
. |
. |
11.3 |
. |
. |
. |
. |
. |
. |
. |
. |
. |
. |
. |
. |
| M |
Sheets & Strip Galv Hot Dipped -- C & A |
. |
. |
119.1 |
. |
. |
. |
. |
. |
. |
. |
. |
. |
. |
. |
. |
. |
| M |
Sheets Cold Rolled -- C & A |
. |
. |
172.6 |
. |
. |
. |
. |
. |
10.6 |
. |
. |
. |
. |
. |
. |
. |
| M |
Structural Pipe & Tube -- C & A |
. |
. |
. |
. |
. |
. |
. |
. |
. |
. |
. |
. |
. |
. |
. |
3.15 |
| M |
Structural Shapes Heavy -- C & A |
8,943 |
. |
4.49 |
1.45 |
4.81 |
. |
11.1 |
5,878 |
4,882 |
6,552 |
. |
. |
. |
. |
0.85 |
. |
| Stainless Products |
| M |
All Stainless Products |
91.5 |
. |
0.99 |
. |
. |
. |
. |
. |
. |
. |
. |
. |
13.8 |
. |
. |
. |
| M |
Bars-Cold Finished -- S |
55.4 |
. |
. |
. |
. |
. |
. |
. |
. |
. |
. |
. |
13.1 |
. |
. |
. |
| M |
Oil Country Goods -- S |
. |
. |
. |
. |
. |
. |
. |
. |
. |
. |
. |
. |
0.69 |
. |
. |
. |
| M |
Line Pipe -- S |
. |
. |
0.99 |
. |
. |
. |
. |
. |
. |
. |
. |
. |
. |
. |
. |
. |
| M |
Stainless Pipe & Tubing -- S |
36.1 |
. |
. |
. |
. |
. |
. |
. |
. |
. |
. |
. |
. |
. |
. |
. |