Over time, residents in the "Reduced Hours" programs reported reductions of safety events relative to other programs
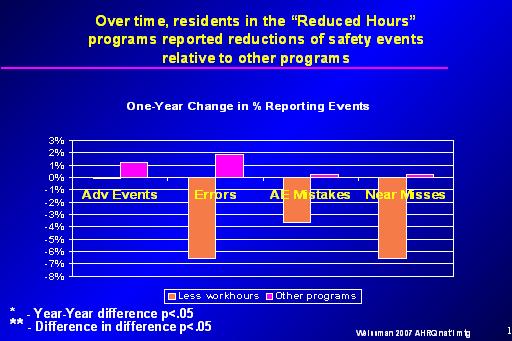
Bar chart entitled "One-Year Change in % Reporting Events."
The graph shows a year-year difference of p<.05, and the difference in difference of p<.05. The data is as follows:
| Event Type |
Less workhours difference |
Other programs difference |
| Adv Events |
No data |
+1% |
| Errors |
-6.5% |
+2% |
| AE Mistakes |
-3.9% |
+.1% |
| Near Misses |
-6.7% |
+.1% |
Notes:
Medical Error = Near miss or AE due to mistake
 Previous Slide Contents Next Slide


 540 Gaither Road Rockville, MD 20850